Scottish vs Menominee Associate's Degree
COMPARE
Scottish
Menominee
Associate's Degree
Associate's Degree Comparison
Scottish
Menominee
46.9%
ASSOCIATE'S DEGREE
65.4/ 100
METRIC RATING
160th/ 347
METRIC RANK
36.7%
ASSOCIATE'S DEGREE
0.0/ 100
METRIC RATING
325th/ 347
METRIC RANK
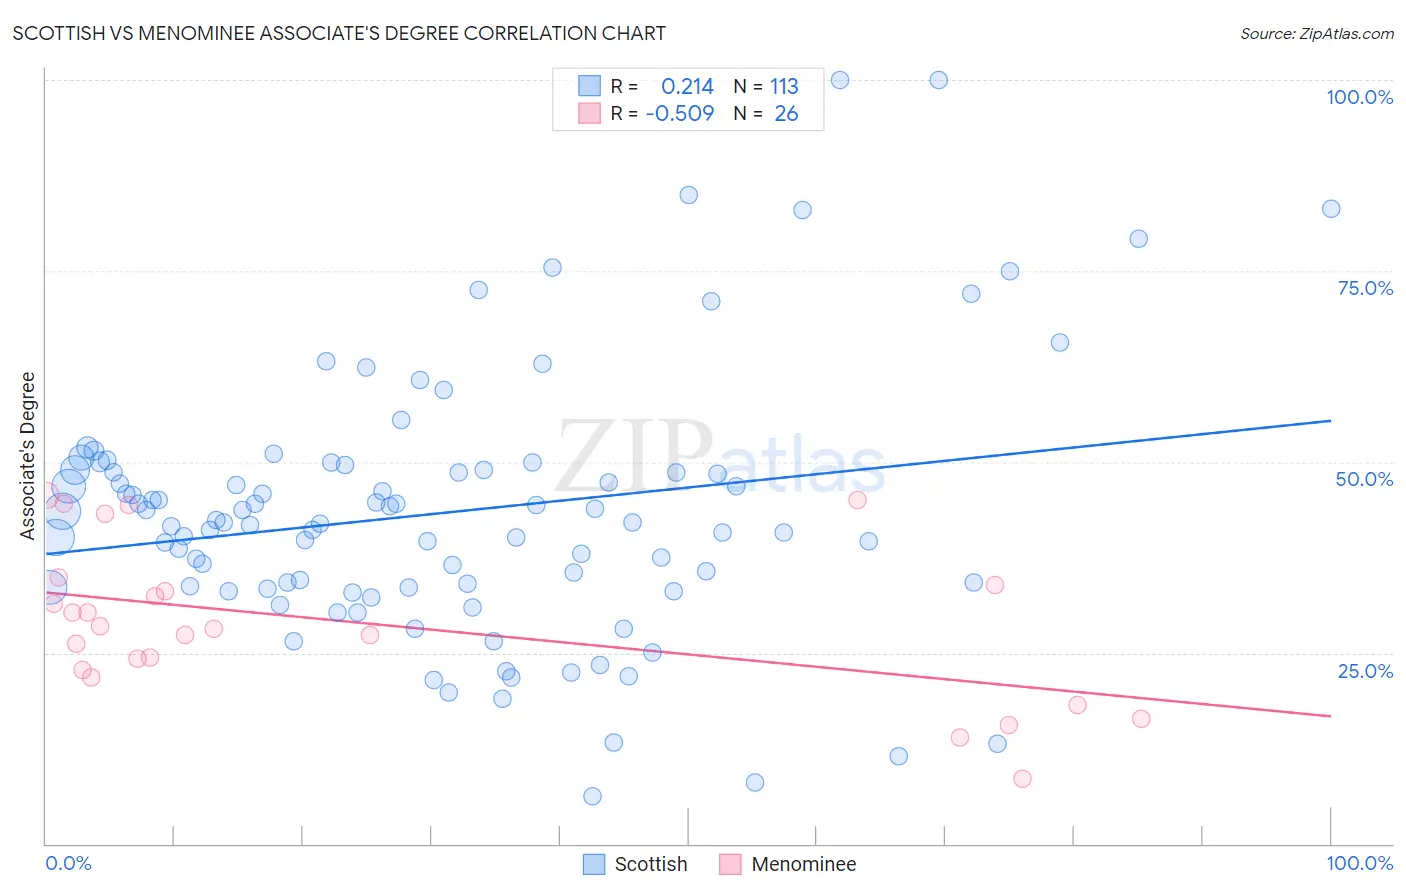
Scottish vs Menominee Associate's Degree Correlation Chart
The statistical analysis conducted on geographies consisting of 567,065,260 people shows a weak positive correlation between the proportion of Scottish and percentage of population with at least associate's degree education in the United States with a correlation coefficient (R) of 0.214 and weighted average of 46.9%. Similarly, the statistical analysis conducted on geographies consisting of 45,778,979 people shows a substantial negative correlation between the proportion of Menominee and percentage of population with at least associate's degree education in the United States with a correlation coefficient (R) of -0.509 and weighted average of 36.7%, a difference of 27.9%.
Associate's Degree Correlation Summary
| Measurement | Scottish | Menominee |
| Minimum | 6.2% | 8.5% |
| Maximum | 100.0% | 45.6% |
| Range | 93.7% | 37.1% |
| Mean | 43.3% | 28.9% |
| Median | 42.0% | 28.3% |
| Interquartile 25% (IQ1) | 33.6% | 22.8% |
| Interquartile 75% (IQ3) | 49.0% | 33.8% |
| Interquartile Range (IQR) | 15.4% | 11.0% |
| Standard Deviation (Sample) | 17.2% | 10.1% |
| Standard Deviation (Population) | 17.1% | 9.9% |
Similar Demographics by Associate's Degree
Demographics Similar to Scottish by Associate's Degree
In terms of associate's degree, the demographic groups most similar to Scottish are Scandinavian (46.9%, a difference of 0.020%), Immigrants from Africa (46.8%, a difference of 0.18%), Somali (46.8%, a difference of 0.23%), Colombian (46.8%, a difference of 0.24%), and Immigrants from Poland (47.1%, a difference of 0.31%).
| Demographics | Rating | Rank | Associate's Degree |
| Czechs | 72.2 /100 | #153 | Good 47.2% |
| Immigrants | Kenya | 72.1 /100 | #154 | Good 47.2% |
| Kenyans | 70.6 /100 | #155 | Good 47.1% |
| South Americans | 70.5 /100 | #156 | Good 47.1% |
| Sudanese | 70.3 /100 | #157 | Good 47.1% |
| Immigrants | Germany | 69.7 /100 | #158 | Good 47.1% |
| Immigrants | Poland | 69.2 /100 | #159 | Good 47.1% |
| Scottish | 65.4 /100 | #160 | Good 46.9% |
| Scandinavians | 65.2 /100 | #161 | Good 46.9% |
| Immigrants | Africa | 63.2 /100 | #162 | Good 46.8% |
| Somalis | 62.5 /100 | #163 | Good 46.8% |
| Colombians | 62.4 /100 | #164 | Good 46.8% |
| Immigrants | South America | 59.9 /100 | #165 | Average 46.7% |
| Hungarians | 59.3 /100 | #166 | Average 46.7% |
| Immigrants | Sierra Leone | 59.2 /100 | #167 | Average 46.7% |
Demographics Similar to Menominee by Associate's Degree
In terms of associate's degree, the demographic groups most similar to Menominee are Arapaho (36.7%, a difference of 0.11%), Immigrants from Cabo Verde (36.8%, a difference of 0.27%), Kiowa (36.5%, a difference of 0.56%), Dutch West Indian (36.5%, a difference of 0.58%), and Alaskan Athabascan (36.5%, a difference of 0.59%).
| Demographics | Rating | Rank | Associate's Degree |
| Alaska Natives | 0.0 /100 | #318 | Tragic 37.5% |
| Fijians | 0.0 /100 | #319 | Tragic 37.4% |
| Cajuns | 0.0 /100 | #320 | Tragic 37.4% |
| Immigrants | Yemen | 0.0 /100 | #321 | Tragic 37.3% |
| Pennsylvania Germans | 0.0 /100 | #322 | Tragic 37.2% |
| Immigrants | Cabo Verde | 0.0 /100 | #323 | Tragic 36.8% |
| Arapaho | 0.0 /100 | #324 | Tragic 36.7% |
| Menominee | 0.0 /100 | #325 | Tragic 36.7% |
| Kiowa | 0.0 /100 | #326 | Tragic 36.5% |
| Dutch West Indians | 0.0 /100 | #327 | Tragic 36.5% |
| Alaskan Athabascans | 0.0 /100 | #328 | Tragic 36.5% |
| Paiute | 0.0 /100 | #329 | Tragic 36.4% |
| Apache | 0.0 /100 | #330 | Tragic 36.2% |
| Immigrants | Azores | 0.0 /100 | #331 | Tragic 35.6% |
| Immigrants | Central America | 0.0 /100 | #332 | Tragic 35.0% |