Immigrants from Ghana vs Menominee Associate's Degree
COMPARE
Immigrants from Ghana
Menominee
Associate's Degree
Associate's Degree Comparison
Immigrants from Ghana
Menominee
44.8%
ASSOCIATE'S DEGREE
14.2/ 100
METRIC RATING
213th/ 347
METRIC RANK
36.7%
ASSOCIATE'S DEGREE
0.0/ 100
METRIC RATING
325th/ 347
METRIC RANK
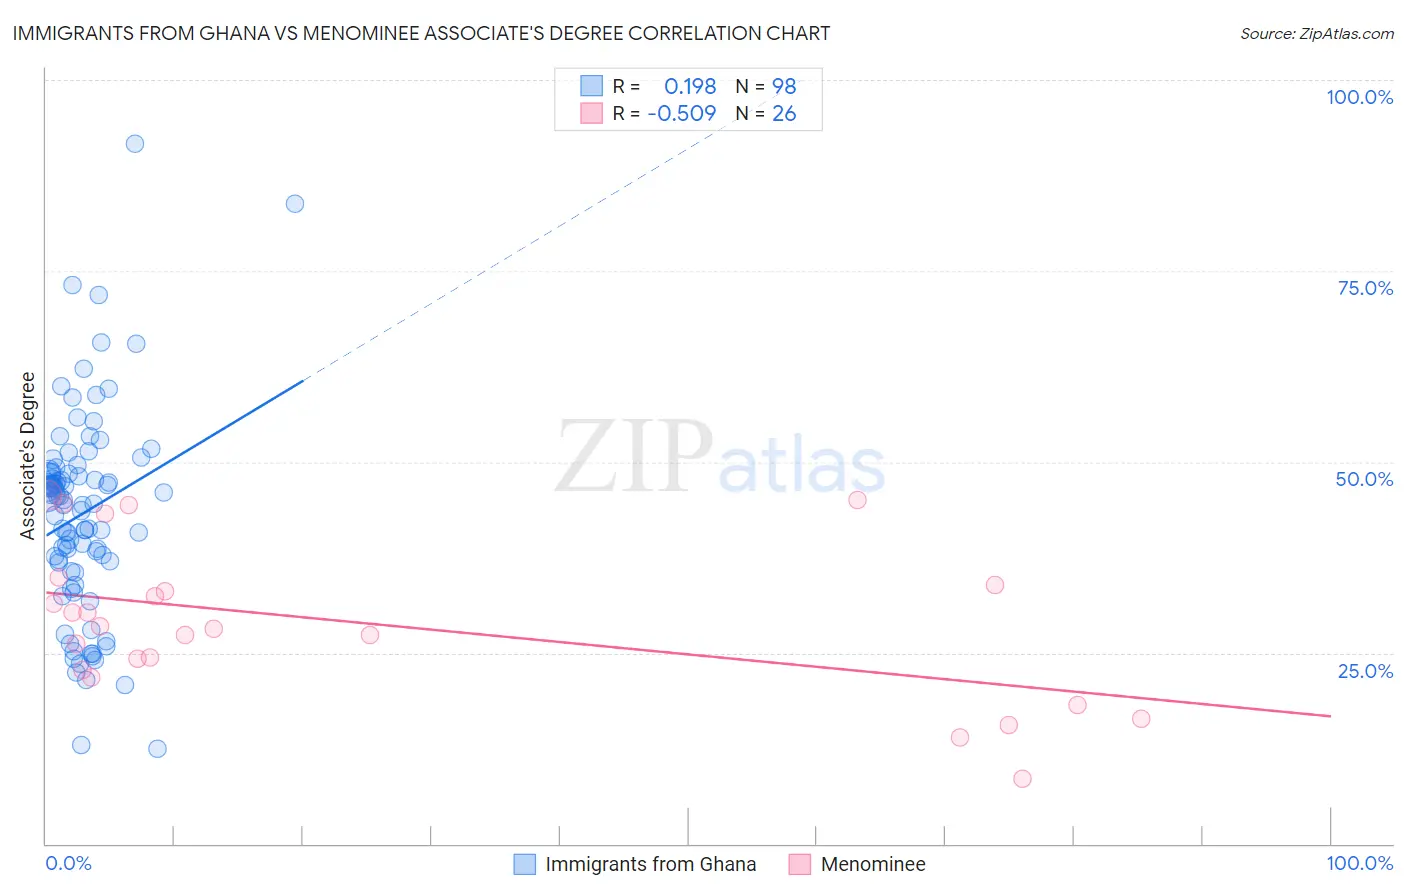
Immigrants from Ghana vs Menominee Associate's Degree Correlation Chart
The statistical analysis conducted on geographies consisting of 199,944,026 people shows a poor positive correlation between the proportion of Immigrants from Ghana and percentage of population with at least associate's degree education in the United States with a correlation coefficient (R) of 0.198 and weighted average of 44.8%. Similarly, the statistical analysis conducted on geographies consisting of 45,778,979 people shows a substantial negative correlation between the proportion of Menominee and percentage of population with at least associate's degree education in the United States with a correlation coefficient (R) of -0.509 and weighted average of 36.7%, a difference of 22.1%.
Associate's Degree Correlation Summary
| Measurement | Immigrants from Ghana | Menominee |
| Minimum | 12.5% | 8.5% |
| Maximum | 91.7% | 45.6% |
| Range | 79.2% | 37.1% |
| Mean | 43.2% | 28.9% |
| Median | 44.8% | 28.3% |
| Interquartile 25% (IQ1) | 36.9% | 22.8% |
| Interquartile 75% (IQ3) | 48.6% | 33.8% |
| Interquartile Range (IQR) | 11.7% | 11.0% |
| Standard Deviation (Sample) | 13.5% | 10.1% |
| Standard Deviation (Population) | 13.4% | 9.9% |
Similar Demographics by Associate's Degree
Demographics Similar to Immigrants from Ghana by Associate's Degree
In terms of associate's degree, the demographic groups most similar to Immigrants from Ghana are French Canadian (44.9%, a difference of 0.12%), Immigrants from Middle Africa (44.7%, a difference of 0.25%), Immigrants from Panama (44.7%, a difference of 0.31%), Immigrants from Zaire (45.0%, a difference of 0.35%), and Immigrants from Philippines (45.0%, a difference of 0.36%).
| Demographics | Rating | Rank | Associate's Degree |
| German Russians | 18.9 /100 | #206 | Poor 45.1% |
| Panamanians | 18.4 /100 | #207 | Poor 45.1% |
| Dutch | 17.6 /100 | #208 | Poor 45.0% |
| Immigrants | Costa Rica | 16.7 /100 | #209 | Poor 45.0% |
| Immigrants | Philippines | 16.7 /100 | #210 | Poor 45.0% |
| Immigrants | Zaire | 16.6 /100 | #211 | Poor 45.0% |
| French Canadians | 15.0 /100 | #212 | Poor 44.9% |
| Immigrants | Ghana | 14.2 /100 | #213 | Poor 44.8% |
| Immigrants | Middle Africa | 12.7 /100 | #214 | Poor 44.7% |
| Immigrants | Panama | 12.4 /100 | #215 | Poor 44.7% |
| Immigrants | Nigeria | 11.4 /100 | #216 | Poor 44.6% |
| Immigrants | Immigrants | 10.5 /100 | #217 | Poor 44.5% |
| Spanish | 9.4 /100 | #218 | Tragic 44.4% |
| Whites/Caucasians | 7.5 /100 | #219 | Tragic 44.2% |
| Portuguese | 7.2 /100 | #220 | Tragic 44.1% |
Demographics Similar to Menominee by Associate's Degree
In terms of associate's degree, the demographic groups most similar to Menominee are Arapaho (36.7%, a difference of 0.11%), Immigrants from Cabo Verde (36.8%, a difference of 0.27%), Kiowa (36.5%, a difference of 0.56%), Dutch West Indian (36.5%, a difference of 0.58%), and Alaskan Athabascan (36.5%, a difference of 0.59%).
| Demographics | Rating | Rank | Associate's Degree |
| Alaska Natives | 0.0 /100 | #318 | Tragic 37.5% |
| Fijians | 0.0 /100 | #319 | Tragic 37.4% |
| Cajuns | 0.0 /100 | #320 | Tragic 37.4% |
| Immigrants | Yemen | 0.0 /100 | #321 | Tragic 37.3% |
| Pennsylvania Germans | 0.0 /100 | #322 | Tragic 37.2% |
| Immigrants | Cabo Verde | 0.0 /100 | #323 | Tragic 36.8% |
| Arapaho | 0.0 /100 | #324 | Tragic 36.7% |
| Menominee | 0.0 /100 | #325 | Tragic 36.7% |
| Kiowa | 0.0 /100 | #326 | Tragic 36.5% |
| Dutch West Indians | 0.0 /100 | #327 | Tragic 36.5% |
| Alaskan Athabascans | 0.0 /100 | #328 | Tragic 36.5% |
| Paiute | 0.0 /100 | #329 | Tragic 36.4% |
| Apache | 0.0 /100 | #330 | Tragic 36.2% |
| Immigrants | Azores | 0.0 /100 | #331 | Tragic 35.6% |
| Immigrants | Central America | 0.0 /100 | #332 | Tragic 35.0% |