Immigrants from Switzerland vs Menominee Associate's Degree
COMPARE
Immigrants from Switzerland
Menominee
Associate's Degree
Associate's Degree Comparison
Immigrants from Switzerland
Menominee
54.5%
ASSOCIATE'S DEGREE
100.0/ 100
METRIC RATING
25th/ 347
METRIC RANK
36.7%
ASSOCIATE'S DEGREE
0.0/ 100
METRIC RATING
325th/ 347
METRIC RANK
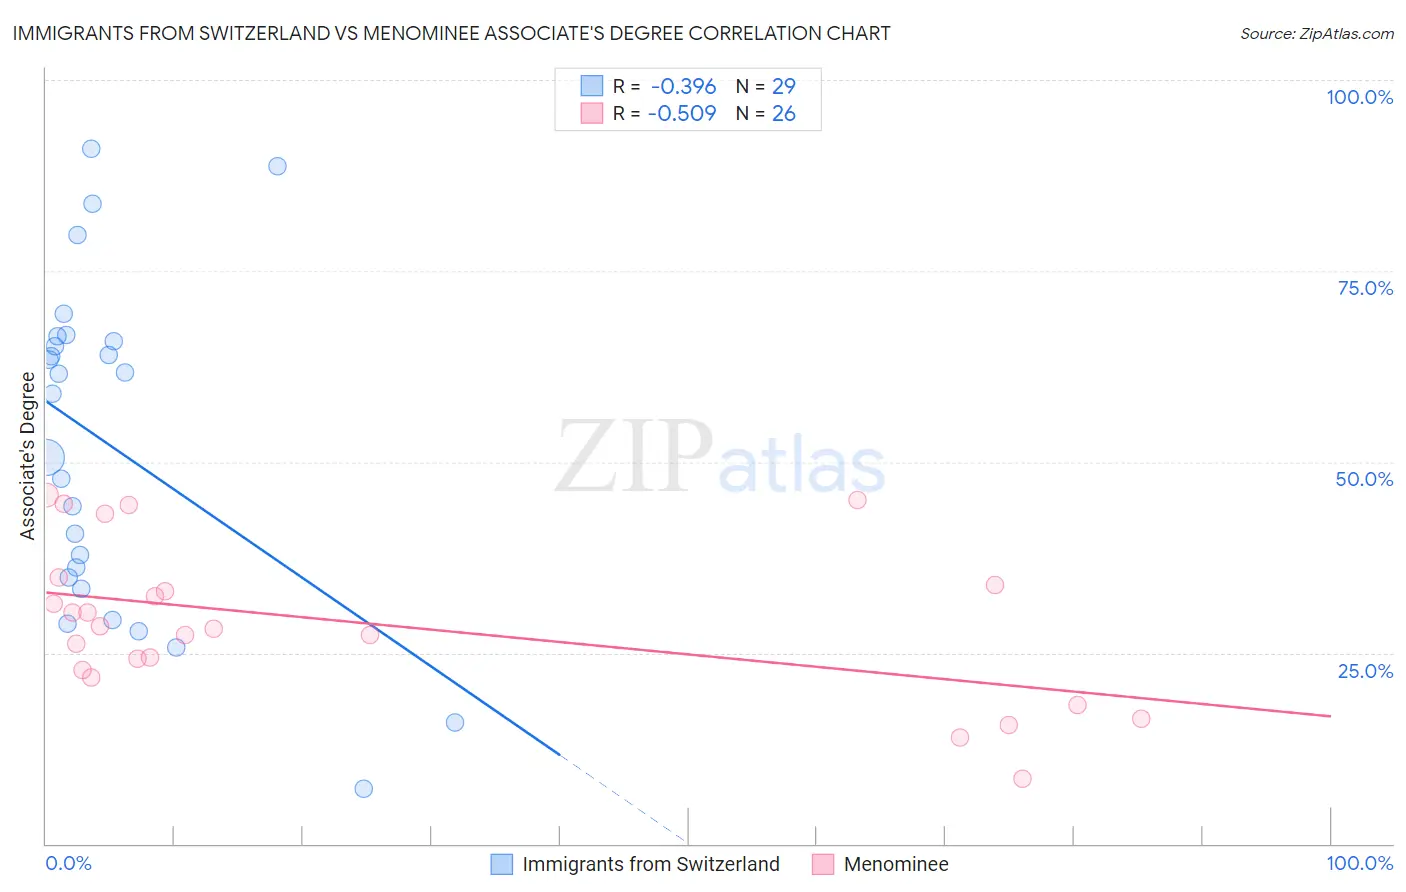
Immigrants from Switzerland vs Menominee Associate's Degree Correlation Chart
The statistical analysis conducted on geographies consisting of 148,083,488 people shows a mild negative correlation between the proportion of Immigrants from Switzerland and percentage of population with at least associate's degree education in the United States with a correlation coefficient (R) of -0.396 and weighted average of 54.5%. Similarly, the statistical analysis conducted on geographies consisting of 45,778,979 people shows a substantial negative correlation between the proportion of Menominee and percentage of population with at least associate's degree education in the United States with a correlation coefficient (R) of -0.509 and weighted average of 36.7%, a difference of 48.6%.
Associate's Degree Correlation Summary
| Measurement | Immigrants from Switzerland | Menominee |
| Minimum | 7.2% | 8.5% |
| Maximum | 91.0% | 45.6% |
| Range | 83.7% | 37.1% |
| Mean | 52.1% | 28.9% |
| Median | 58.9% | 28.3% |
| Interquartile 25% (IQ1) | 34.1% | 22.8% |
| Interquartile 75% (IQ3) | 66.1% | 33.8% |
| Interquartile Range (IQR) | 32.0% | 11.0% |
| Standard Deviation (Sample) | 21.8% | 10.1% |
| Standard Deviation (Population) | 21.4% | 9.9% |
Similar Demographics by Associate's Degree
Demographics Similar to Immigrants from Switzerland by Associate's Degree
In terms of associate's degree, the demographic groups most similar to Immigrants from Switzerland are Immigrants from Korea (54.5%, a difference of 0.030%), Immigrants from Belgium (54.5%, a difference of 0.030%), Immigrants from Japan (54.6%, a difference of 0.12%), Burmese (54.6%, a difference of 0.12%), and Immigrants from Sweden (54.6%, a difference of 0.16%).
| Demographics | Rating | Rank | Associate's Degree |
| Indians (Asian) | 100.0 /100 | #18 | Exceptional 54.8% |
| Immigrants | Ireland | 100.0 /100 | #19 | Exceptional 54.7% |
| Cambodians | 100.0 /100 | #20 | Exceptional 54.6% |
| Immigrants | Sweden | 100.0 /100 | #21 | Exceptional 54.6% |
| Immigrants | Japan | 100.0 /100 | #22 | Exceptional 54.6% |
| Burmese | 100.0 /100 | #23 | Exceptional 54.6% |
| Immigrants | Korea | 100.0 /100 | #24 | Exceptional 54.5% |
| Immigrants | Switzerland | 100.0 /100 | #25 | Exceptional 54.5% |
| Immigrants | Belgium | 100.0 /100 | #26 | Exceptional 54.5% |
| Latvians | 100.0 /100 | #27 | Exceptional 53.9% |
| Turks | 100.0 /100 | #28 | Exceptional 53.9% |
| Immigrants | France | 100.0 /100 | #29 | Exceptional 53.9% |
| Immigrants | Sri Lanka | 100.0 /100 | #30 | Exceptional 53.7% |
| Immigrants | Northern Europe | 100.0 /100 | #31 | Exceptional 53.5% |
| Immigrants | Turkey | 100.0 /100 | #32 | Exceptional 53.4% |
Demographics Similar to Menominee by Associate's Degree
In terms of associate's degree, the demographic groups most similar to Menominee are Arapaho (36.7%, a difference of 0.11%), Immigrants from Cabo Verde (36.8%, a difference of 0.27%), Kiowa (36.5%, a difference of 0.56%), Dutch West Indian (36.5%, a difference of 0.58%), and Alaskan Athabascan (36.5%, a difference of 0.59%).
| Demographics | Rating | Rank | Associate's Degree |
| Alaska Natives | 0.0 /100 | #318 | Tragic 37.5% |
| Fijians | 0.0 /100 | #319 | Tragic 37.4% |
| Cajuns | 0.0 /100 | #320 | Tragic 37.4% |
| Immigrants | Yemen | 0.0 /100 | #321 | Tragic 37.3% |
| Pennsylvania Germans | 0.0 /100 | #322 | Tragic 37.2% |
| Immigrants | Cabo Verde | 0.0 /100 | #323 | Tragic 36.8% |
| Arapaho | 0.0 /100 | #324 | Tragic 36.7% |
| Menominee | 0.0 /100 | #325 | Tragic 36.7% |
| Kiowa | 0.0 /100 | #326 | Tragic 36.5% |
| Dutch West Indians | 0.0 /100 | #327 | Tragic 36.5% |
| Alaskan Athabascans | 0.0 /100 | #328 | Tragic 36.5% |
| Paiute | 0.0 /100 | #329 | Tragic 36.4% |
| Apache | 0.0 /100 | #330 | Tragic 36.2% |
| Immigrants | Azores | 0.0 /100 | #331 | Tragic 35.6% |
| Immigrants | Central America | 0.0 /100 | #332 | Tragic 35.0% |