Hispanic or Latino vs Immigrants from Russia Associate's Degree
COMPARE
Hispanic or Latino
Immigrants from Russia
Associate's Degree
Associate's Degree Comparison
Hispanics or Latinos
Immigrants from Russia
37.7%
ASSOCIATE'S DEGREE
0.0/ 100
METRIC RATING
313th/ 347
METRIC RANK
53.1%
ASSOCIATE'S DEGREE
100.0/ 100
METRIC RATING
36th/ 347
METRIC RANK
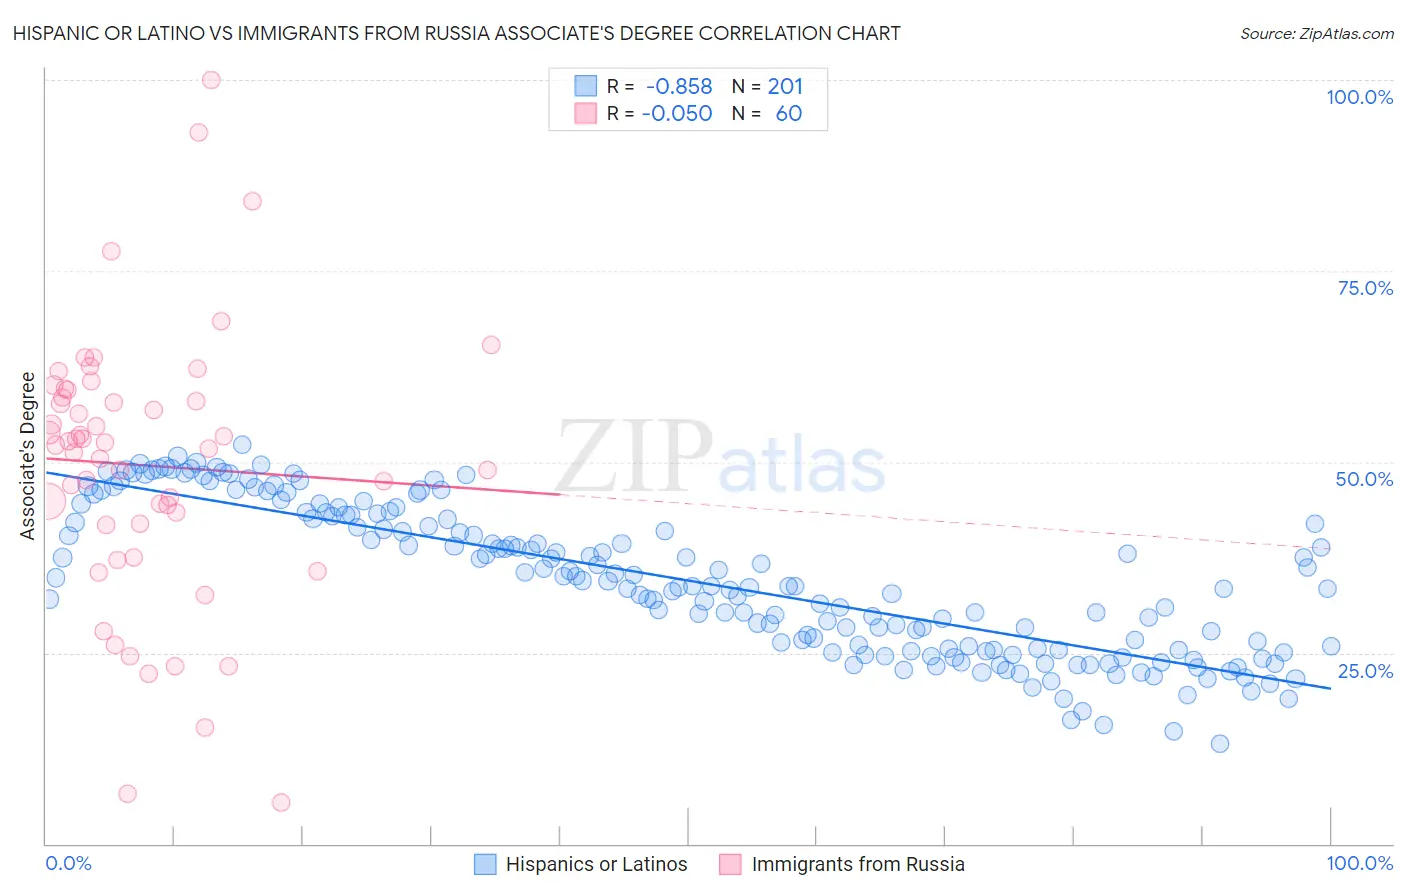
Hispanic or Latino vs Immigrants from Russia Associate's Degree Correlation Chart
The statistical analysis conducted on geographies consisting of 578,463,109 people shows a very strong negative correlation between the proportion of Hispanics or Latinos and percentage of population with at least associate's degree education in the United States with a correlation coefficient (R) of -0.858 and weighted average of 37.7%. Similarly, the statistical analysis conducted on geographies consisting of 347,909,323 people shows no correlation between the proportion of Immigrants from Russia and percentage of population with at least associate's degree education in the United States with a correlation coefficient (R) of -0.050 and weighted average of 53.1%, a difference of 40.7%.
Associate's Degree Correlation Summary
| Measurement | Hispanic or Latino | Immigrants from Russia |
| Minimum | 13.1% | 5.4% |
| Maximum | 52.2% | 100.0% |
| Range | 39.2% | 94.6% |
| Mean | 34.4% | 49.5% |
| Median | 33.7% | 52.4% |
| Interquartile 25% (IQ1) | 25.5% | 41.8% |
| Interquartile 75% (IQ3) | 42.9% | 59.0% |
| Interquartile Range (IQR) | 17.5% | 17.1% |
| Standard Deviation (Sample) | 9.6% | 17.9% |
| Standard Deviation (Population) | 9.6% | 17.7% |
Similar Demographics by Associate's Degree
Demographics Similar to Hispanics or Latinos by Associate's Degree
In terms of associate's degree, the demographic groups most similar to Hispanics or Latinos are Seminole (37.7%, a difference of 0.050%), Choctaw (37.8%, a difference of 0.15%), Immigrants from Latin America (37.9%, a difference of 0.37%), Creek (37.6%, a difference of 0.44%), and Crow (37.6%, a difference of 0.45%).
| Demographics | Rating | Rank | Associate's Degree |
| Shoshone | 0.0 /100 | #306 | Tragic 38.4% |
| Immigrants | El Salvador | 0.0 /100 | #307 | Tragic 38.4% |
| Mexican American Indians | 0.0 /100 | #308 | Tragic 38.2% |
| Immigrants | Guatemala | 0.0 /100 | #309 | Tragic 38.1% |
| Immigrants | Dominican Republic | 0.0 /100 | #310 | Tragic 37.9% |
| Immigrants | Latin America | 0.0 /100 | #311 | Tragic 37.9% |
| Choctaw | 0.0 /100 | #312 | Tragic 37.8% |
| Hispanics or Latinos | 0.0 /100 | #313 | Tragic 37.7% |
| Seminole | 0.0 /100 | #314 | Tragic 37.7% |
| Creek | 0.0 /100 | #315 | Tragic 37.6% |
| Crow | 0.0 /100 | #316 | Tragic 37.6% |
| Yaqui | 0.0 /100 | #317 | Tragic 37.6% |
| Alaska Natives | 0.0 /100 | #318 | Tragic 37.5% |
| Fijians | 0.0 /100 | #319 | Tragic 37.4% |
| Cajuns | 0.0 /100 | #320 | Tragic 37.4% |
Demographics Similar to Immigrants from Russia by Associate's Degree
In terms of associate's degree, the demographic groups most similar to Immigrants from Russia are Immigrants from Denmark (53.1%, a difference of 0.080%), Mongolian (53.0%, a difference of 0.25%), Russian (53.2%, a difference of 0.28%), Bulgarian (53.3%, a difference of 0.35%), and Immigrants from Belarus (52.8%, a difference of 0.53%).
| Demographics | Rating | Rank | Associate's Degree |
| Immigrants | France | 100.0 /100 | #29 | Exceptional 53.9% |
| Immigrants | Sri Lanka | 100.0 /100 | #30 | Exceptional 53.7% |
| Immigrants | Northern Europe | 100.0 /100 | #31 | Exceptional 53.5% |
| Immigrants | Turkey | 100.0 /100 | #32 | Exceptional 53.4% |
| Israelis | 100.0 /100 | #33 | Exceptional 53.4% |
| Bulgarians | 100.0 /100 | #34 | Exceptional 53.3% |
| Russians | 100.0 /100 | #35 | Exceptional 53.2% |
| Immigrants | Russia | 100.0 /100 | #36 | Exceptional 53.1% |
| Immigrants | Denmark | 100.0 /100 | #37 | Exceptional 53.1% |
| Mongolians | 100.0 /100 | #38 | Exceptional 53.0% |
| Immigrants | Belarus | 99.9 /100 | #39 | Exceptional 52.8% |
| Immigrants | Latvia | 99.9 /100 | #40 | Exceptional 52.8% |
| Immigrants | Saudi Arabia | 99.9 /100 | #41 | Exceptional 52.6% |
| Immigrants | Malaysia | 99.9 /100 | #42 | Exceptional 52.5% |
| Immigrants | South Africa | 99.9 /100 | #43 | Exceptional 52.5% |