Immigrants from Asia vs Immigrants from Russia Associate's Degree
COMPARE
Immigrants from Asia
Immigrants from Russia
Associate's Degree
Associate's Degree Comparison
Immigrants from Asia
Immigrants from Russia
52.0%
ASSOCIATE'S DEGREE
99.8/ 100
METRIC RATING
53rd/ 347
METRIC RANK
53.1%
ASSOCIATE'S DEGREE
100.0/ 100
METRIC RATING
36th/ 347
METRIC RANK
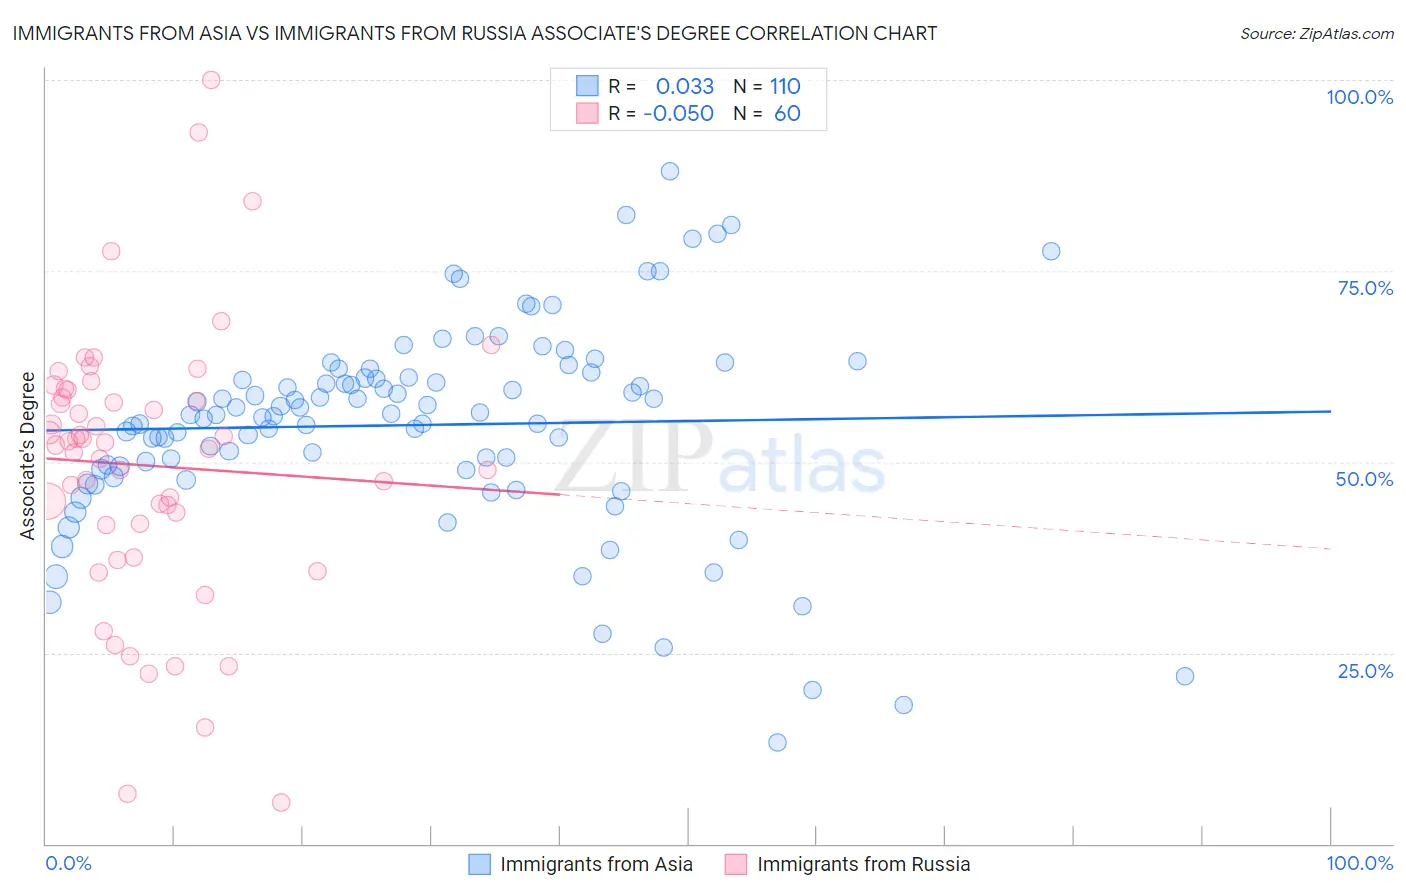
Immigrants from Asia vs Immigrants from Russia Associate's Degree Correlation Chart
The statistical analysis conducted on geographies consisting of 549,095,102 people shows no correlation between the proportion of Immigrants from Asia and percentage of population with at least associate's degree education in the United States with a correlation coefficient (R) of 0.033 and weighted average of 52.0%. Similarly, the statistical analysis conducted on geographies consisting of 347,909,323 people shows no correlation between the proportion of Immigrants from Russia and percentage of population with at least associate's degree education in the United States with a correlation coefficient (R) of -0.050 and weighted average of 53.1%, a difference of 2.2%.
Associate's Degree Correlation Summary
| Measurement | Immigrants from Asia | Immigrants from Russia |
| Minimum | 13.2% | 5.4% |
| Maximum | 88.0% | 100.0% |
| Range | 74.8% | 94.6% |
| Mean | 54.8% | 49.5% |
| Median | 56.2% | 52.4% |
| Interquartile 25% (IQ1) | 49.0% | 41.8% |
| Interquartile 75% (IQ3) | 61.1% | 59.0% |
| Interquartile Range (IQR) | 12.0% | 17.1% |
| Standard Deviation (Sample) | 13.4% | 17.9% |
| Standard Deviation (Population) | 13.4% | 17.7% |
Demographics Similar to Immigrants from Asia and Immigrants from Russia by Associate's Degree
In terms of associate's degree, the demographic groups most similar to Immigrants from Asia are Bolivian (52.0%, a difference of 0.020%), Immigrants from Spain (51.9%, a difference of 0.10%), Immigrants from Greece (52.1%, a difference of 0.23%), Asian (52.1%, a difference of 0.31%), and Immigrants from Austria (52.1%, a difference of 0.33%). Similarly, the demographic groups most similar to Immigrants from Russia are Immigrants from Denmark (53.1%, a difference of 0.080%), Mongolian (53.0%, a difference of 0.25%), Russian (53.2%, a difference of 0.28%), Bulgarian (53.3%, a difference of 0.35%), and Immigrants from Belarus (52.8%, a difference of 0.53%).
| Demographics | Rating | Rank | Associate's Degree |
| Bulgarians | 100.0 /100 | #34 | Exceptional 53.3% |
| Russians | 100.0 /100 | #35 | Exceptional 53.2% |
| Immigrants | Russia | 100.0 /100 | #36 | Exceptional 53.1% |
| Immigrants | Denmark | 100.0 /100 | #37 | Exceptional 53.1% |
| Mongolians | 100.0 /100 | #38 | Exceptional 53.0% |
| Immigrants | Belarus | 99.9 /100 | #39 | Exceptional 52.8% |
| Immigrants | Latvia | 99.9 /100 | #40 | Exceptional 52.8% |
| Immigrants | Saudi Arabia | 99.9 /100 | #41 | Exceptional 52.6% |
| Immigrants | Malaysia | 99.9 /100 | #42 | Exceptional 52.5% |
| Immigrants | South Africa | 99.9 /100 | #43 | Exceptional 52.5% |
| Estonians | 99.9 /100 | #44 | Exceptional 52.5% |
| Immigrants | Lithuania | 99.9 /100 | #45 | Exceptional 52.4% |
| Immigrants | Bulgaria | 99.9 /100 | #46 | Exceptional 52.4% |
| Immigrants | Kuwait | 99.9 /100 | #47 | Exceptional 52.4% |
| Immigrants | Norway | 99.9 /100 | #48 | Exceptional 52.2% |
| Immigrants | Austria | 99.9 /100 | #49 | Exceptional 52.1% |
| Asians | 99.9 /100 | #50 | Exceptional 52.1% |
| Immigrants | Greece | 99.9 /100 | #51 | Exceptional 52.1% |
| Bolivians | 99.8 /100 | #52 | Exceptional 52.0% |
| Immigrants | Asia | 99.8 /100 | #53 | Exceptional 52.0% |
| Immigrants | Spain | 99.8 /100 | #54 | Exceptional 51.9% |