Immigrants from Israel vs Immigrants from Russia Associate's Degree
COMPARE
Immigrants from Israel
Immigrants from Russia
Associate's Degree
Associate's Degree Comparison
Immigrants from Israel
Immigrants from Russia
56.8%
ASSOCIATE'S DEGREE
100.0/ 100
METRIC RATING
9th/ 347
METRIC RANK
53.1%
ASSOCIATE'S DEGREE
100.0/ 100
METRIC RATING
36th/ 347
METRIC RANK
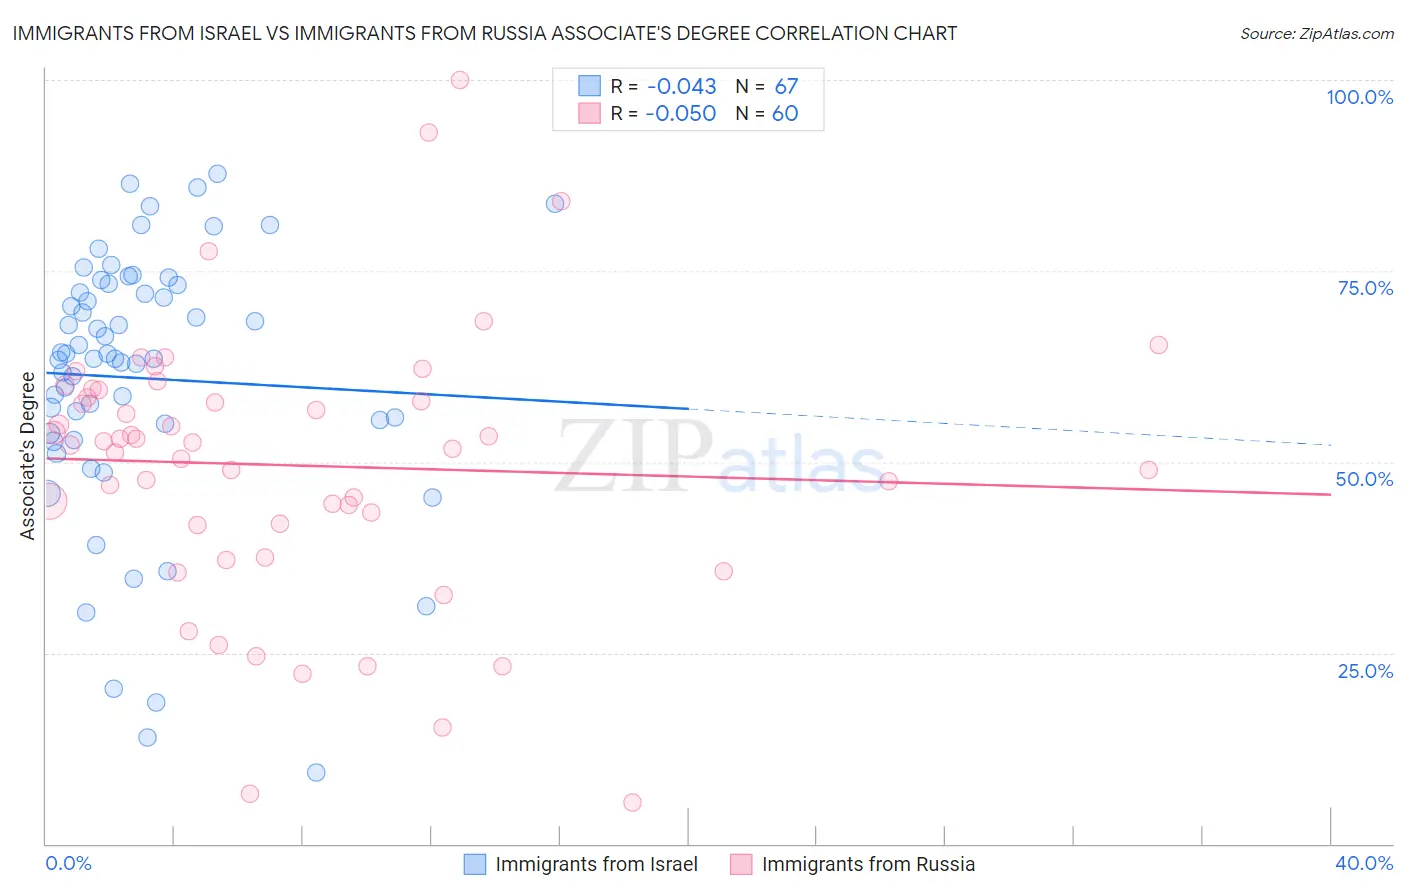
Immigrants from Israel vs Immigrants from Russia Associate's Degree Correlation Chart
The statistical analysis conducted on geographies consisting of 210,027,202 people shows no correlation between the proportion of Immigrants from Israel and percentage of population with at least associate's degree education in the United States with a correlation coefficient (R) of -0.043 and weighted average of 56.8%. Similarly, the statistical analysis conducted on geographies consisting of 347,909,323 people shows no correlation between the proportion of Immigrants from Russia and percentage of population with at least associate's degree education in the United States with a correlation coefficient (R) of -0.050 and weighted average of 53.1%, a difference of 7.0%.
Associate's Degree Correlation Summary
| Measurement | Immigrants from Israel | Immigrants from Russia |
| Minimum | 9.3% | 5.4% |
| Maximum | 87.7% | 100.0% |
| Range | 78.4% | 94.6% |
| Mean | 61.0% | 49.5% |
| Median | 63.5% | 52.4% |
| Interquartile 25% (IQ1) | 53.7% | 41.8% |
| Interquartile 75% (IQ3) | 73.2% | 59.0% |
| Interquartile Range (IQR) | 19.5% | 17.1% |
| Standard Deviation (Sample) | 17.4% | 17.9% |
| Standard Deviation (Population) | 17.3% | 17.7% |
Similar Demographics by Associate's Degree
Demographics Similar to Immigrants from Israel by Associate's Degree
In terms of associate's degree, the demographic groups most similar to Immigrants from Israel are Cypriot (56.4%, a difference of 0.72%), Thai (57.4%, a difference of 1.1%), Immigrants from Iran (57.7%, a difference of 1.5%), Okinawan (57.7%, a difference of 1.6%), and Immigrants from Australia (55.8%, a difference of 1.8%).
| Demographics | Rating | Rank | Associate's Degree |
| Immigrants | Singapore | 100.0 /100 | #2 | Exceptional 58.9% |
| Immigrants | India | 100.0 /100 | #3 | Exceptional 58.5% |
| Immigrants | Taiwan | 100.0 /100 | #4 | Exceptional 58.4% |
| Iranians | 100.0 /100 | #5 | Exceptional 58.2% |
| Okinawans | 100.0 /100 | #6 | Exceptional 57.7% |
| Immigrants | Iran | 100.0 /100 | #7 | Exceptional 57.7% |
| Thais | 100.0 /100 | #8 | Exceptional 57.4% |
| Immigrants | Israel | 100.0 /100 | #9 | Exceptional 56.8% |
| Cypriots | 100.0 /100 | #10 | Exceptional 56.4% |
| Immigrants | Australia | 100.0 /100 | #11 | Exceptional 55.8% |
| Immigrants | South Central Asia | 100.0 /100 | #12 | Exceptional 55.7% |
| Immigrants | China | 100.0 /100 | #13 | Exceptional 55.5% |
| Immigrants | Hong Kong | 100.0 /100 | #14 | Exceptional 55.4% |
| Immigrants | Eastern Asia | 100.0 /100 | #15 | Exceptional 55.4% |
| Soviet Union | 100.0 /100 | #16 | Exceptional 55.1% |
Demographics Similar to Immigrants from Russia by Associate's Degree
In terms of associate's degree, the demographic groups most similar to Immigrants from Russia are Immigrants from Denmark (53.1%, a difference of 0.080%), Mongolian (53.0%, a difference of 0.25%), Russian (53.2%, a difference of 0.28%), Bulgarian (53.3%, a difference of 0.35%), and Immigrants from Belarus (52.8%, a difference of 0.53%).
| Demographics | Rating | Rank | Associate's Degree |
| Immigrants | France | 100.0 /100 | #29 | Exceptional 53.9% |
| Immigrants | Sri Lanka | 100.0 /100 | #30 | Exceptional 53.7% |
| Immigrants | Northern Europe | 100.0 /100 | #31 | Exceptional 53.5% |
| Immigrants | Turkey | 100.0 /100 | #32 | Exceptional 53.4% |
| Israelis | 100.0 /100 | #33 | Exceptional 53.4% |
| Bulgarians | 100.0 /100 | #34 | Exceptional 53.3% |
| Russians | 100.0 /100 | #35 | Exceptional 53.2% |
| Immigrants | Russia | 100.0 /100 | #36 | Exceptional 53.1% |
| Immigrants | Denmark | 100.0 /100 | #37 | Exceptional 53.1% |
| Mongolians | 100.0 /100 | #38 | Exceptional 53.0% |
| Immigrants | Belarus | 99.9 /100 | #39 | Exceptional 52.8% |
| Immigrants | Latvia | 99.9 /100 | #40 | Exceptional 52.8% |
| Immigrants | Saudi Arabia | 99.9 /100 | #41 | Exceptional 52.6% |
| Immigrants | Malaysia | 99.9 /100 | #42 | Exceptional 52.5% |
| Immigrants | South Africa | 99.9 /100 | #43 | Exceptional 52.5% |