Aleut vs Immigrants from Nepal 1st Grade
COMPARE
Aleut
Immigrants from Nepal
1st Grade
1st Grade Comparison
Aleuts
Immigrants from Nepal
98.6%
1ST GRADE
100.0/ 100
METRIC RATING
16th/ 347
METRIC RANK
97.7%
1ST GRADE
4.0/ 100
METRIC RATING
225th/ 347
METRIC RANK
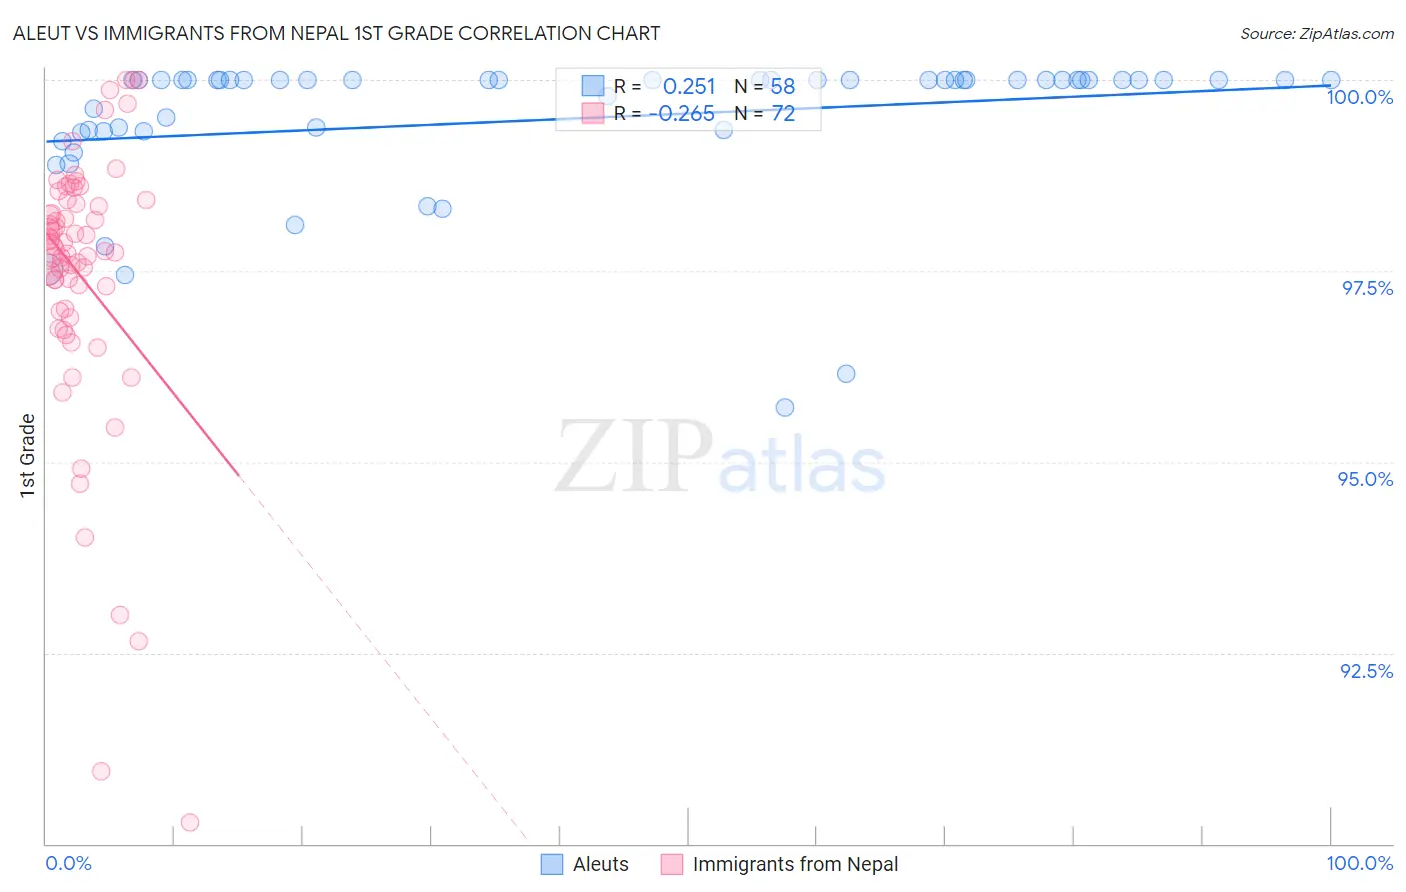
Aleut vs Immigrants from Nepal 1st Grade Correlation Chart
The statistical analysis conducted on geographies consisting of 61,781,127 people shows a weak positive correlation between the proportion of Aleuts and percentage of population with at least 1st grade education in the United States with a correlation coefficient (R) of 0.251 and weighted average of 98.6%. Similarly, the statistical analysis conducted on geographies consisting of 186,766,254 people shows a weak negative correlation between the proportion of Immigrants from Nepal and percentage of population with at least 1st grade education in the United States with a correlation coefficient (R) of -0.265 and weighted average of 97.7%, a difference of 0.96%.
1st Grade Correlation Summary
| Measurement | Aleut | Immigrants from Nepal |
| Minimum | 95.7% | 90.3% |
| Maximum | 100.0% | 100.0% |
| Range | 4.3% | 9.7% |
| Mean | 99.5% | 97.4% |
| Median | 100.0% | 97.8% |
| Interquartile 25% (IQ1) | 99.3% | 97.0% |
| Interquartile 75% (IQ3) | 100.0% | 98.4% |
| Interquartile Range (IQR) | 0.67% | 1.4% |
| Standard Deviation (Sample) | 0.95% | 1.8% |
| Standard Deviation (Population) | 0.94% | 1.8% |
Similar Demographics by 1st Grade
Demographics Similar to Aleuts by 1st Grade
In terms of 1st grade, the demographic groups most similar to Aleuts are Scottish (98.6%, a difference of 0.0%), Swedish (98.6%, a difference of 0.010%), Dutch (98.6%, a difference of 0.010%), Carpatho Rusyn (98.6%, a difference of 0.030%), and English (98.6%, a difference of 0.030%).
| Demographics | Rating | Rank | 1st Grade |
| Slovaks | 100.0 /100 | #9 | Exceptional 98.7% |
| Germans | 100.0 /100 | #10 | Exceptional 98.7% |
| Tlingit-Haida | 100.0 /100 | #11 | Exceptional 98.7% |
| Slovenes | 100.0 /100 | #12 | Exceptional 98.7% |
| Carpatho Rusyns | 100.0 /100 | #13 | Exceptional 98.6% |
| English | 100.0 /100 | #14 | Exceptional 98.6% |
| Swedes | 100.0 /100 | #15 | Exceptional 98.6% |
| Aleuts | 100.0 /100 | #16 | Exceptional 98.6% |
| Scottish | 100.0 /100 | #17 | Exceptional 98.6% |
| Dutch | 100.0 /100 | #18 | Exceptional 98.6% |
| Irish | 100.0 /100 | #19 | Exceptional 98.6% |
| Sioux | 100.0 /100 | #20 | Exceptional 98.6% |
| Arapaho | 100.0 /100 | #21 | Exceptional 98.6% |
| Pennsylvania Germans | 100.0 /100 | #22 | Exceptional 98.6% |
| Finns | 100.0 /100 | #23 | Exceptional 98.6% |
Demographics Similar to Immigrants from Nepal by 1st Grade
In terms of 1st grade, the demographic groups most similar to Immigrants from Nepal are Immigrants from Syria (97.7%, a difference of 0.0%), Immigrants from Zaire (97.7%, a difference of 0.0%), Iraqi (97.7%, a difference of 0.0%), Sudanese (97.7%, a difference of 0.0%), and Tongan (97.7%, a difference of 0.010%).
| Demographics | Rating | Rank | 1st Grade |
| Immigrants | Morocco | 5.3 /100 | #218 | Tragic 97.7% |
| Immigrants | Panama | 5.2 /100 | #219 | Tragic 97.7% |
| Tongans | 4.6 /100 | #220 | Tragic 97.7% |
| Immigrants | Sudan | 4.3 /100 | #221 | Tragic 97.7% |
| Immigrants | Syria | 4.2 /100 | #222 | Tragic 97.7% |
| Immigrants | Zaire | 4.1 /100 | #223 | Tragic 97.7% |
| Iraqis | 4.0 /100 | #224 | Tragic 97.7% |
| Immigrants | Nepal | 4.0 /100 | #225 | Tragic 97.7% |
| Sudanese | 3.7 /100 | #226 | Tragic 97.7% |
| Sierra Leoneans | 3.6 /100 | #227 | Tragic 97.7% |
| Sub-Saharan Africans | 3.6 /100 | #228 | Tragic 97.7% |
| Immigrants | Costa Rica | 3.5 /100 | #229 | Tragic 97.7% |
| Senegalese | 3.5 /100 | #230 | Tragic 97.7% |
| Puerto Ricans | 3.0 /100 | #231 | Tragic 97.7% |
| Immigrants | Uruguay | 2.5 /100 | #232 | Tragic 97.6% |