Aleut vs Cape Verdean Master's Degree
COMPARE
Aleut
Cape Verdean
Master's Degree
Master's Degree Comparison
Aleuts
Cape Verdeans
11.8%
MASTER'S DEGREE
0.1/ 100
METRIC RATING
286th/ 347
METRIC RANK
12.1%
MASTER'S DEGREE
0.3/ 100
METRIC RATING
274th/ 347
METRIC RANK
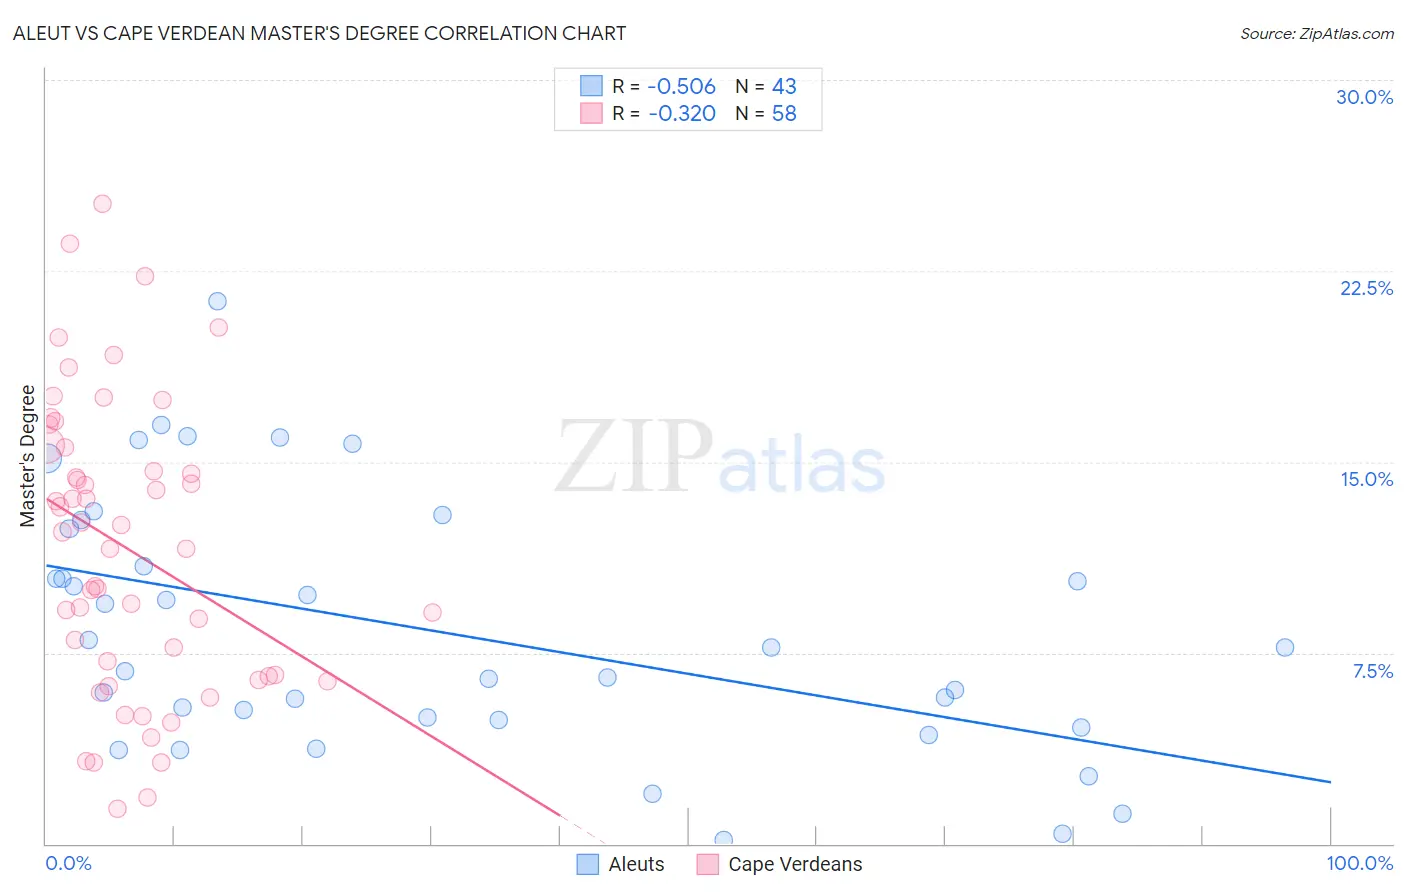
Aleut vs Cape Verdean Master's Degree Correlation Chart
The statistical analysis conducted on geographies consisting of 61,771,787 people shows a substantial negative correlation between the proportion of Aleuts and percentage of population with at least master's degree education in the United States with a correlation coefficient (R) of -0.506 and weighted average of 11.8%. Similarly, the statistical analysis conducted on geographies consisting of 107,570,267 people shows a mild negative correlation between the proportion of Cape Verdeans and percentage of population with at least master's degree education in the United States with a correlation coefficient (R) of -0.320 and weighted average of 12.1%, a difference of 2.3%.
Master's Degree Correlation Summary
| Measurement | Aleut | Cape Verdean |
| Minimum | 0.13% | 1.4% |
| Maximum | 21.3% | 25.1% |
| Range | 21.2% | 23.8% |
| Mean | 8.4% | 11.6% |
| Median | 7.7% | 11.9% |
| Interquartile 25% (IQ1) | 4.9% | 6.6% |
| Interquartile 75% (IQ3) | 12.4% | 15.6% |
| Interquartile Range (IQR) | 7.5% | 9.0% |
| Standard Deviation (Sample) | 5.0% | 5.7% |
| Standard Deviation (Population) | 4.9% | 5.7% |
Demographics Similar to Aleuts and Cape Verdeans by Master's Degree
In terms of master's degree, the demographic groups most similar to Aleuts are Immigrants from Haiti (11.8%, a difference of 0.20%), Immigrants from Nicaragua (11.8%, a difference of 0.35%), Immigrants from Honduras (11.8%, a difference of 0.36%), Guatemalan (11.7%, a difference of 0.44%), and Ottawa (11.9%, a difference of 0.54%). Similarly, the demographic groups most similar to Cape Verdeans are Cuban (12.1%, a difference of 0.020%), Black/African American (12.1%, a difference of 0.070%), Immigrants from Caribbean (12.1%, a difference of 0.080%), Potawatomi (12.1%, a difference of 0.080%), and Blackfeet (12.1%, a difference of 0.090%).
| Demographics | Rating | Rank | Master's Degree |
| Salvadorans | 0.3 /100 | #270 | Tragic 12.2% |
| Haitians | 0.3 /100 | #271 | Tragic 12.1% |
| Comanche | 0.3 /100 | #272 | Tragic 12.1% |
| Blackfeet | 0.3 /100 | #273 | Tragic 12.1% |
| Cape Verdeans | 0.3 /100 | #274 | Tragic 12.1% |
| Cubans | 0.3 /100 | #275 | Tragic 12.1% |
| Blacks/African Americans | 0.3 /100 | #276 | Tragic 12.1% |
| Immigrants | Caribbean | 0.3 /100 | #277 | Tragic 12.1% |
| Potawatomi | 0.3 /100 | #278 | Tragic 12.1% |
| Immigrants | Belize | 0.2 /100 | #279 | Tragic 12.1% |
| Immigrants | Dominican Republic | 0.2 /100 | #280 | Tragic 12.1% |
| Malaysians | 0.2 /100 | #281 | Tragic 12.0% |
| Immigrants | El Salvador | 0.2 /100 | #282 | Tragic 12.0% |
| Hondurans | 0.2 /100 | #283 | Tragic 11.9% |
| Ottawa | 0.2 /100 | #284 | Tragic 11.9% |
| Immigrants | Nicaragua | 0.2 /100 | #285 | Tragic 11.8% |
| Aleuts | 0.1 /100 | #286 | Tragic 11.8% |
| Immigrants | Haiti | 0.1 /100 | #287 | Tragic 11.8% |
| Immigrants | Honduras | 0.1 /100 | #288 | Tragic 11.8% |
| Guatemalans | 0.1 /100 | #289 | Tragic 11.7% |
| Ute | 0.1 /100 | #290 | Tragic 11.7% |