Aleut vs Immigrants from Iran Master's Degree
COMPARE
Aleut
Immigrants from Iran
Master's Degree
Master's Degree Comparison
Aleuts
Immigrants from Iran
11.8%
MASTER'S DEGREE
0.1/ 100
METRIC RATING
286th/ 347
METRIC RANK
21.6%
MASTER'S DEGREE
100.0/ 100
METRIC RATING
10th/ 347
METRIC RANK
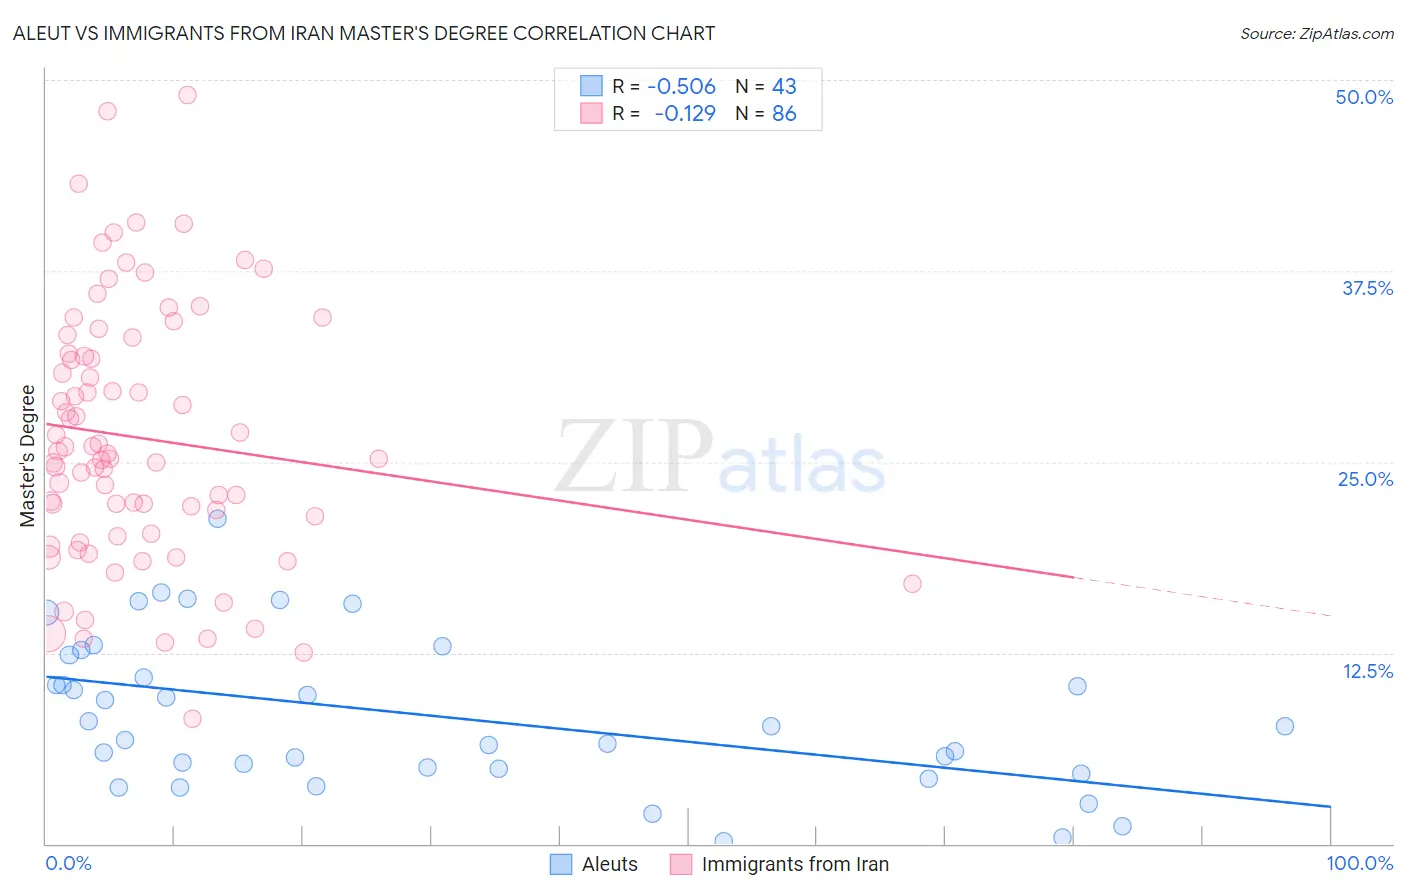
Aleut vs Immigrants from Iran Master's Degree Correlation Chart
The statistical analysis conducted on geographies consisting of 61,771,787 people shows a substantial negative correlation between the proportion of Aleuts and percentage of population with at least master's degree education in the United States with a correlation coefficient (R) of -0.506 and weighted average of 11.8%. Similarly, the statistical analysis conducted on geographies consisting of 279,879,707 people shows a poor negative correlation between the proportion of Immigrants from Iran and percentage of population with at least master's degree education in the United States with a correlation coefficient (R) of -0.129 and weighted average of 21.6%, a difference of 83.3%.
Master's Degree Correlation Summary
| Measurement | Aleut | Immigrants from Iran |
| Minimum | 0.13% | 8.2% |
| Maximum | 21.3% | 49.0% |
| Range | 21.2% | 40.8% |
| Mean | 8.4% | 26.6% |
| Median | 7.7% | 25.4% |
| Interquartile 25% (IQ1) | 4.9% | 20.3% |
| Interquartile 75% (IQ3) | 12.4% | 32.1% |
| Interquartile Range (IQR) | 7.5% | 11.8% |
| Standard Deviation (Sample) | 5.0% | 8.4% |
| Standard Deviation (Population) | 4.9% | 8.4% |
Similar Demographics by Master's Degree
Demographics Similar to Aleuts by Master's Degree
In terms of master's degree, the demographic groups most similar to Aleuts are Immigrants from Haiti (11.8%, a difference of 0.20%), Immigrants from Nicaragua (11.8%, a difference of 0.35%), Immigrants from Honduras (11.8%, a difference of 0.36%), Guatemalan (11.7%, a difference of 0.44%), and Ottawa (11.9%, a difference of 0.54%).
| Demographics | Rating | Rank | Master's Degree |
| Immigrants | Belize | 0.2 /100 | #279 | Tragic 12.1% |
| Immigrants | Dominican Republic | 0.2 /100 | #280 | Tragic 12.1% |
| Malaysians | 0.2 /100 | #281 | Tragic 12.0% |
| Immigrants | El Salvador | 0.2 /100 | #282 | Tragic 12.0% |
| Hondurans | 0.2 /100 | #283 | Tragic 11.9% |
| Ottawa | 0.2 /100 | #284 | Tragic 11.9% |
| Immigrants | Nicaragua | 0.2 /100 | #285 | Tragic 11.8% |
| Aleuts | 0.1 /100 | #286 | Tragic 11.8% |
| Immigrants | Haiti | 0.1 /100 | #287 | Tragic 11.8% |
| Immigrants | Honduras | 0.1 /100 | #288 | Tragic 11.8% |
| Guatemalans | 0.1 /100 | #289 | Tragic 11.7% |
| Ute | 0.1 /100 | #290 | Tragic 11.7% |
| Colville | 0.1 /100 | #291 | Tragic 11.6% |
| Immigrants | Guatemala | 0.1 /100 | #292 | Tragic 11.6% |
| Alaska Natives | 0.1 /100 | #293 | Tragic 11.6% |
Demographics Similar to Immigrants from Iran by Master's Degree
In terms of master's degree, the demographic groups most similar to Immigrants from Iran are Thai (21.7%, a difference of 0.41%), Cypriot (21.8%, a difference of 0.75%), Immigrants from China (21.2%, a difference of 2.1%), Eastern European (21.1%, a difference of 2.4%), and Iranian (22.3%, a difference of 3.0%).
| Demographics | Rating | Rank | Master's Degree |
| Immigrants | Israel | 100.0 /100 | #3 | Exceptional 22.6% |
| Okinawans | 100.0 /100 | #4 | Exceptional 22.6% |
| Immigrants | Taiwan | 100.0 /100 | #5 | Exceptional 22.5% |
| Immigrants | India | 100.0 /100 | #6 | Exceptional 22.3% |
| Iranians | 100.0 /100 | #7 | Exceptional 22.3% |
| Cypriots | 100.0 /100 | #8 | Exceptional 21.8% |
| Thais | 100.0 /100 | #9 | Exceptional 21.7% |
| Immigrants | Iran | 100.0 /100 | #10 | Exceptional 21.6% |
| Immigrants | China | 100.0 /100 | #11 | Exceptional 21.2% |
| Eastern Europeans | 100.0 /100 | #12 | Exceptional 21.1% |
| Immigrants | Australia | 100.0 /100 | #13 | Exceptional 20.9% |
| Immigrants | Switzerland | 100.0 /100 | #14 | Exceptional 20.9% |
| Immigrants | Eastern Asia | 100.0 /100 | #15 | Exceptional 20.8% |
| Immigrants | Belgium | 100.0 /100 | #16 | Exceptional 20.8% |
| Immigrants | South Central Asia | 100.0 /100 | #17 | Exceptional 20.7% |