Aleut vs American Master's Degree
COMPARE
Aleut
American
Master's Degree
Master's Degree Comparison
Aleuts
Americans
11.8%
MASTER'S DEGREE
0.1/ 100
METRIC RATING
286th/ 347
METRIC RANK
12.3%
MASTER'S DEGREE
0.4/ 100
METRIC RATING
267th/ 347
METRIC RANK
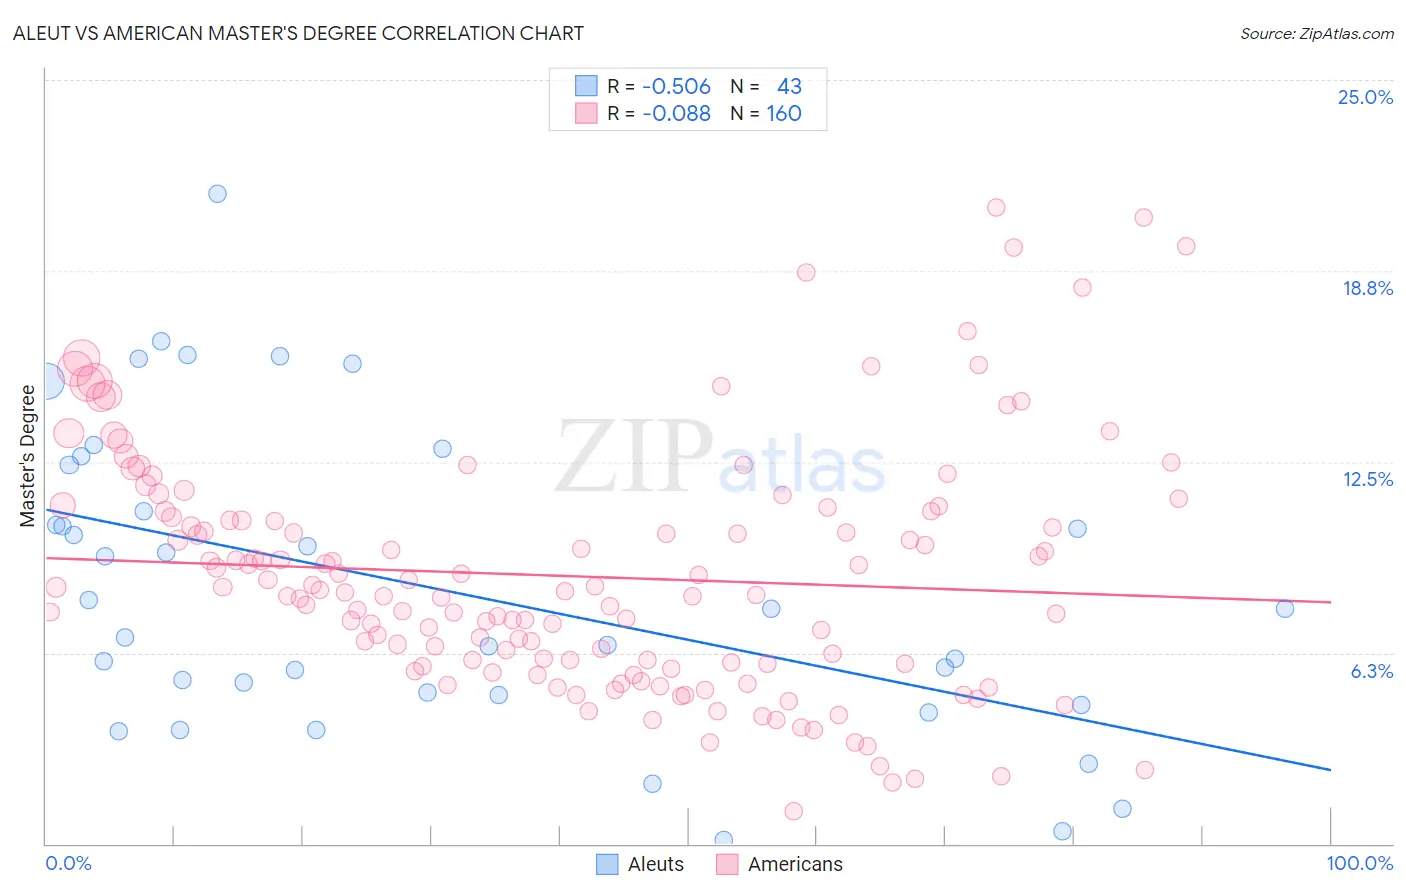
Aleut vs American Master's Degree Correlation Chart
The statistical analysis conducted on geographies consisting of 61,771,787 people shows a substantial negative correlation between the proportion of Aleuts and percentage of population with at least master's degree education in the United States with a correlation coefficient (R) of -0.506 and weighted average of 11.8%. Similarly, the statistical analysis conducted on geographies consisting of 580,510,045 people shows a slight negative correlation between the proportion of Americans and percentage of population with at least master's degree education in the United States with a correlation coefficient (R) of -0.088 and weighted average of 12.3%, a difference of 4.3%.
Master's Degree Correlation Summary
| Measurement | Aleut | American |
| Minimum | 0.13% | 1.1% |
| Maximum | 21.3% | 20.8% |
| Range | 21.2% | 19.8% |
| Mean | 8.4% | 8.8% |
| Median | 7.7% | 8.3% |
| Interquartile 25% (IQ1) | 4.9% | 5.9% |
| Interquartile 75% (IQ3) | 12.4% | 10.8% |
| Interquartile Range (IQR) | 7.5% | 4.9% |
| Standard Deviation (Sample) | 5.0% | 3.9% |
| Standard Deviation (Population) | 4.9% | 3.9% |
Demographics Similar to Aleuts and Americans by Master's Degree
In terms of master's degree, the demographic groups most similar to Aleuts are Immigrants from Nicaragua (11.8%, a difference of 0.35%), Ottawa (11.9%, a difference of 0.54%), Honduran (11.9%, a difference of 1.3%), Immigrants from El Salvador (12.0%, a difference of 1.7%), and Malaysian (12.0%, a difference of 2.0%). Similarly, the demographic groups most similar to Americans are Native Hawaiian (12.3%, a difference of 0.25%), Bahamian (12.4%, a difference of 0.76%), Central American (12.2%, a difference of 0.90%), Salvadoran (12.2%, a difference of 1.0%), and Haitian (12.1%, a difference of 1.6%).
| Demographics | Rating | Rank | Master's Degree |
| Bahamians | 0.5 /100 | #266 | Tragic 12.4% |
| Americans | 0.4 /100 | #267 | Tragic 12.3% |
| Native Hawaiians | 0.4 /100 | #268 | Tragic 12.3% |
| Central Americans | 0.3 /100 | #269 | Tragic 12.2% |
| Salvadorans | 0.3 /100 | #270 | Tragic 12.2% |
| Haitians | 0.3 /100 | #271 | Tragic 12.1% |
| Comanche | 0.3 /100 | #272 | Tragic 12.1% |
| Blackfeet | 0.3 /100 | #273 | Tragic 12.1% |
| Cape Verdeans | 0.3 /100 | #274 | Tragic 12.1% |
| Cubans | 0.3 /100 | #275 | Tragic 12.1% |
| Blacks/African Americans | 0.3 /100 | #276 | Tragic 12.1% |
| Immigrants | Caribbean | 0.3 /100 | #277 | Tragic 12.1% |
| Potawatomi | 0.3 /100 | #278 | Tragic 12.1% |
| Immigrants | Belize | 0.2 /100 | #279 | Tragic 12.1% |
| Immigrants | Dominican Republic | 0.2 /100 | #280 | Tragic 12.1% |
| Malaysians | 0.2 /100 | #281 | Tragic 12.0% |
| Immigrants | El Salvador | 0.2 /100 | #282 | Tragic 12.0% |
| Hondurans | 0.2 /100 | #283 | Tragic 11.9% |
| Ottawa | 0.2 /100 | #284 | Tragic 11.9% |
| Immigrants | Nicaragua | 0.2 /100 | #285 | Tragic 11.8% |
| Aleuts | 0.1 /100 | #286 | Tragic 11.8% |