Aleut vs Immigrants from Guyana College, 1 year or more
COMPARE
Aleut
Immigrants from Guyana
College, 1 year or more
College, 1 year or more Comparison
Aleuts
Immigrants from Guyana
55.4%
COLLEGE, 1 YEAR OR MORE
0.6/ 100
METRIC RATING
252nd/ 347
METRIC RANK
53.5%
COLLEGE, 1 YEAR OR MORE
0.1/ 100
METRIC RATING
285th/ 347
METRIC RANK
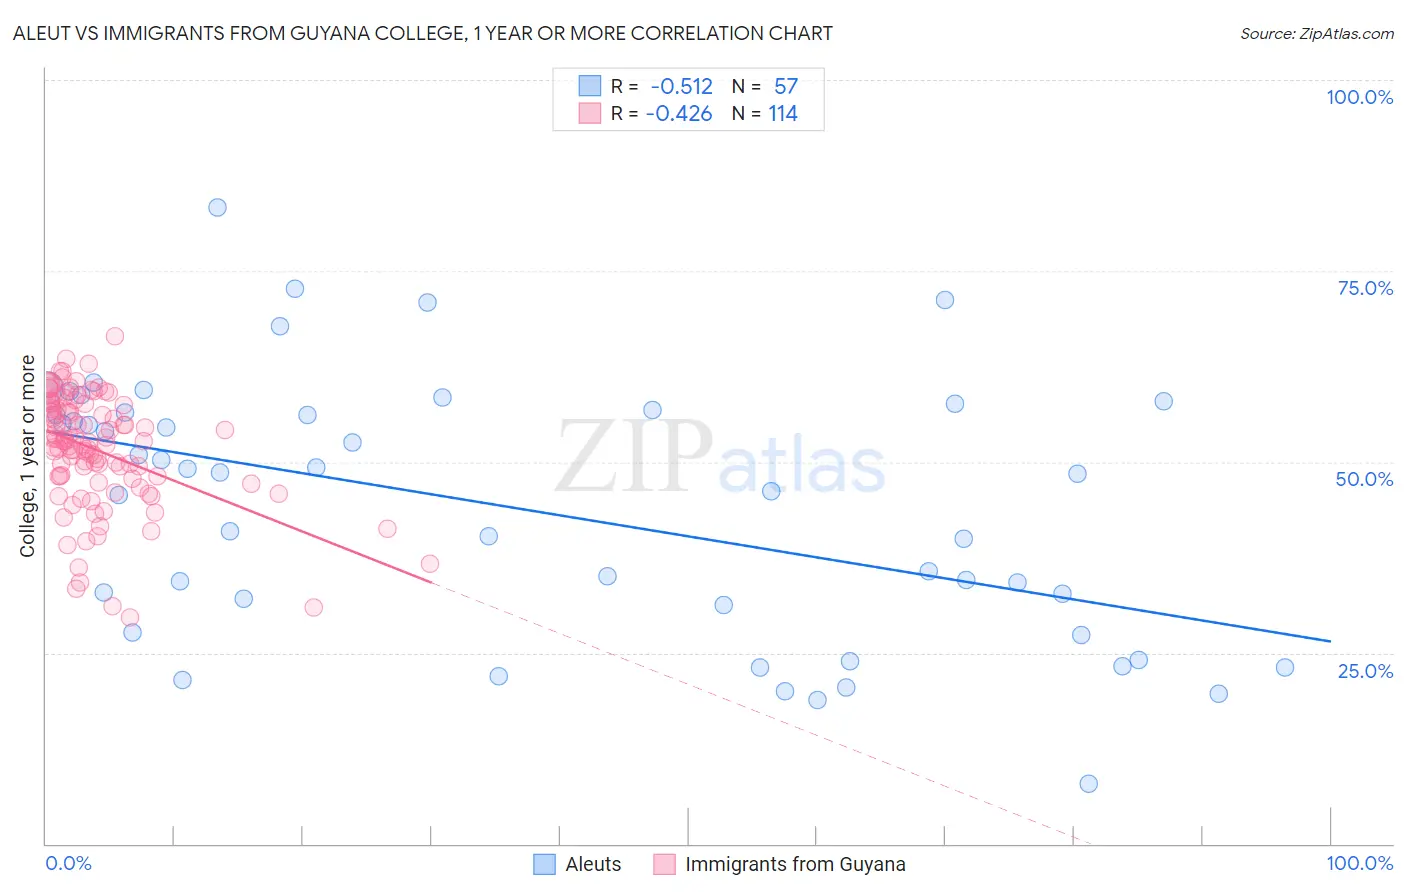
Aleut vs Immigrants from Guyana College, 1 year or more Correlation Chart
The statistical analysis conducted on geographies consisting of 61,782,916 people shows a substantial negative correlation between the proportion of Aleuts and percentage of population with at least college, 1 year or more education in the United States with a correlation coefficient (R) of -0.512 and weighted average of 55.4%. Similarly, the statistical analysis conducted on geographies consisting of 183,735,121 people shows a moderate negative correlation between the proportion of Immigrants from Guyana and percentage of population with at least college, 1 year or more education in the United States with a correlation coefficient (R) of -0.426 and weighted average of 53.5%, a difference of 3.5%.
College, 1 year or more Correlation Summary
| Measurement | Aleut | Immigrants from Guyana |
| Minimum | 7.9% | 29.6% |
| Maximum | 83.3% | 66.5% |
| Range | 75.4% | 36.8% |
| Mean | 43.9% | 51.5% |
| Median | 48.5% | 52.6% |
| Interquartile 25% (IQ1) | 29.5% | 47.8% |
| Interquartile 75% (IQ3) | 56.7% | 57.0% |
| Interquartile Range (IQR) | 27.2% | 9.2% |
| Standard Deviation (Sample) | 16.9% | 7.4% |
| Standard Deviation (Population) | 16.7% | 7.4% |
Similar Demographics by College, 1 year or more
Demographics Similar to Aleuts by College, 1 year or more
In terms of college, 1 year or more, the demographic groups most similar to Aleuts are Immigrants from Cambodia (55.4%, a difference of 0.030%), Immigrants from Barbados (55.4%, a difference of 0.11%), Delaware (55.5%, a difference of 0.12%), Immigrants from Trinidad and Tobago (55.5%, a difference of 0.14%), and Immigrants from Congo (55.6%, a difference of 0.24%).
| Demographics | Rating | Rank | College, 1 year or more |
| Immigrants | Liberia | 0.8 /100 | #245 | Tragic 55.7% |
| Malaysians | 0.8 /100 | #246 | Tragic 55.6% |
| Hawaiians | 0.8 /100 | #247 | Tragic 55.6% |
| Immigrants | Congo | 0.8 /100 | #248 | Tragic 55.6% |
| Immigrants | Trinidad and Tobago | 0.7 /100 | #249 | Tragic 55.5% |
| Delaware | 0.7 /100 | #250 | Tragic 55.5% |
| Immigrants | Cambodia | 0.6 /100 | #251 | Tragic 55.4% |
| Aleuts | 0.6 /100 | #252 | Tragic 55.4% |
| Immigrants | Barbados | 0.6 /100 | #253 | Tragic 55.4% |
| Japanese | 0.5 /100 | #254 | Tragic 55.2% |
| Immigrants | Bahamas | 0.5 /100 | #255 | Tragic 55.2% |
| Immigrants | West Indies | 0.5 /100 | #256 | Tragic 55.2% |
| Indonesians | 0.4 /100 | #257 | Tragic 55.1% |
| Africans | 0.4 /100 | #258 | Tragic 55.0% |
| Nepalese | 0.3 /100 | #259 | Tragic 54.9% |
Demographics Similar to Immigrants from Guyana by College, 1 year or more
In terms of college, 1 year or more, the demographic groups most similar to Immigrants from Guyana are Central American Indian (53.5%, a difference of 0.040%), Immigrants from Belize (53.5%, a difference of 0.080%), Alaska Native (53.4%, a difference of 0.25%), Immigrants from Ecuador (53.4%, a difference of 0.25%), and Alaskan Athabascan (53.4%, a difference of 0.27%).
| Demographics | Rating | Rank | College, 1 year or more |
| Immigrants | Jamaica | 0.1 /100 | #278 | Tragic 54.2% |
| Arapaho | 0.1 /100 | #279 | Tragic 54.1% |
| Cheyenne | 0.1 /100 | #280 | Tragic 54.1% |
| Colville | 0.1 /100 | #281 | Tragic 54.1% |
| Guyanese | 0.1 /100 | #282 | Tragic 54.1% |
| Nicaraguans | 0.1 /100 | #283 | Tragic 53.9% |
| Ute | 0.1 /100 | #284 | Tragic 53.8% |
| Immigrants | Guyana | 0.1 /100 | #285 | Tragic 53.5% |
| Central American Indians | 0.1 /100 | #286 | Tragic 53.5% |
| Immigrants | Belize | 0.1 /100 | #287 | Tragic 53.5% |
| Alaska Natives | 0.0 /100 | #288 | Tragic 53.4% |
| Immigrants | Ecuador | 0.0 /100 | #289 | Tragic 53.4% |
| Alaskan Athabascans | 0.0 /100 | #290 | Tragic 53.4% |
| Cubans | 0.0 /100 | #291 | Tragic 53.4% |
| Chickasaw | 0.0 /100 | #292 | Tragic 53.3% |