Aleut vs Immigrants from China 9th Grade
COMPARE
Aleut
Immigrants from China
9th Grade
9th Grade Comparison
Aleuts
Immigrants from China
96.0%
9TH GRADE
99.8/ 100
METRIC RATING
58th/ 347
METRIC RANK
94.3%
9TH GRADE
2.8/ 100
METRIC RATING
239th/ 347
METRIC RANK
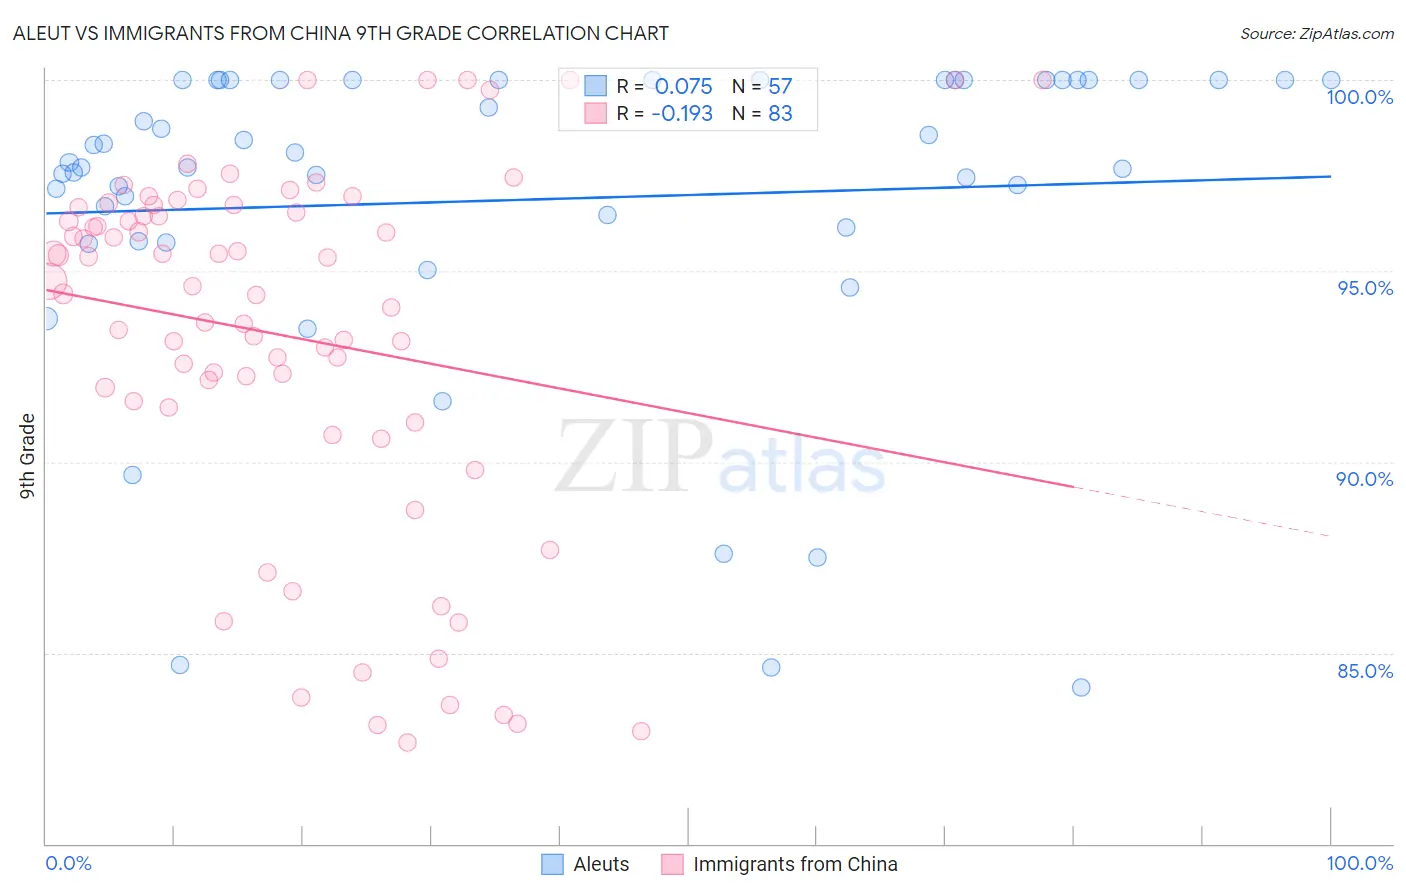
Aleut vs Immigrants from China 9th Grade Correlation Chart
The statistical analysis conducted on geographies consisting of 61,782,786 people shows a slight positive correlation between the proportion of Aleuts and percentage of population with at least 9th grade education in the United States with a correlation coefficient (R) of 0.075 and weighted average of 96.0%. Similarly, the statistical analysis conducted on geographies consisting of 457,082,957 people shows a poor negative correlation between the proportion of Immigrants from China and percentage of population with at least 9th grade education in the United States with a correlation coefficient (R) of -0.193 and weighted average of 94.3%, a difference of 1.8%.
9th Grade Correlation Summary
| Measurement | Aleut | Immigrants from China |
| Minimum | 84.1% | 82.7% |
| Maximum | 100.0% | 100.0% |
| Range | 15.9% | 17.3% |
| Mean | 96.9% | 93.3% |
| Median | 97.8% | 94.6% |
| Interquartile 25% (IQ1) | 96.0% | 91.4% |
| Interquartile 75% (IQ3) | 100.0% | 96.7% |
| Interquartile Range (IQR) | 4.0% | 5.3% |
| Standard Deviation (Sample) | 4.2% | 4.8% |
| Standard Deviation (Population) | 4.1% | 4.7% |
Similar Demographics by 9th Grade
Demographics Similar to Aleuts by 9th Grade
In terms of 9th grade, the demographic groups most similar to Aleuts are Macedonian (96.0%, a difference of 0.0%), Immigrants from Austria (96.0%, a difference of 0.010%), Immigrants from North America (96.0%, a difference of 0.010%), New Zealander (95.9%, a difference of 0.020%), and Immigrants from Canada (96.0%, a difference of 0.030%).
| Demographics | Rating | Rank | 9th Grade |
| Immigrants | Northern Europe | 99.9 /100 | #51 | Exceptional 96.0% |
| Serbians | 99.9 /100 | #52 | Exceptional 96.0% |
| Austrians | 99.8 /100 | #53 | Exceptional 96.0% |
| Immigrants | Canada | 99.8 /100 | #54 | Exceptional 96.0% |
| Immigrants | Austria | 99.8 /100 | #55 | Exceptional 96.0% |
| Immigrants | North America | 99.8 /100 | #56 | Exceptional 96.0% |
| Macedonians | 99.8 /100 | #57 | Exceptional 96.0% |
| Aleuts | 99.8 /100 | #58 | Exceptional 96.0% |
| New Zealanders | 99.8 /100 | #59 | Exceptional 95.9% |
| Native Hawaiians | 99.8 /100 | #60 | Exceptional 95.9% |
| Sioux | 99.8 /100 | #61 | Exceptional 95.9% |
| Ukrainians | 99.7 /100 | #62 | Exceptional 95.9% |
| Canadians | 99.7 /100 | #63 | Exceptional 95.9% |
| Zimbabweans | 99.7 /100 | #64 | Exceptional 95.9% |
| Immigrants | England | 99.6 /100 | #65 | Exceptional 95.9% |
Demographics Similar to Immigrants from China by 9th Grade
In terms of 9th grade, the demographic groups most similar to Immigrants from China are Korean (94.3%, a difference of 0.0%), South American Indian (94.3%, a difference of 0.0%), Somali (94.3%, a difference of 0.010%), Immigrants from Ethiopia (94.3%, a difference of 0.010%), and Spanish American (94.2%, a difference of 0.010%).
| Demographics | Rating | Rank | 9th Grade |
| Immigrants | Africa | 3.9 /100 | #232 | Tragic 94.3% |
| Nigerians | 3.7 /100 | #233 | Tragic 94.3% |
| Costa Ricans | 3.5 /100 | #234 | Tragic 94.3% |
| Bolivians | 3.3 /100 | #235 | Tragic 94.3% |
| Somalis | 2.9 /100 | #236 | Tragic 94.3% |
| Koreans | 2.9 /100 | #237 | Tragic 94.3% |
| South American Indians | 2.8 /100 | #238 | Tragic 94.3% |
| Immigrants | China | 2.8 /100 | #239 | Tragic 94.3% |
| Immigrants | Ethiopia | 2.7 /100 | #240 | Tragic 94.3% |
| Spanish Americans | 2.6 /100 | #241 | Tragic 94.2% |
| Immigrants | Middle Africa | 2.2 /100 | #242 | Tragic 94.2% |
| Immigrants | Cameroon | 2.1 /100 | #243 | Tragic 94.2% |
| Dutch West Indians | 2.0 /100 | #244 | Tragic 94.2% |
| Paiute | 1.9 /100 | #245 | Tragic 94.2% |
| Senegalese | 1.9 /100 | #246 | Tragic 94.2% |