Aleut vs Immigrants from Jordan 9th Grade
COMPARE
Aleut
Immigrants from Jordan
9th Grade
9th Grade Comparison
Aleuts
Immigrants from Jordan
96.0%
9TH GRADE
99.8/ 100
METRIC RATING
58th/ 347
METRIC RANK
95.1%
9TH GRADE
81.2/ 100
METRIC RATING
148th/ 347
METRIC RANK
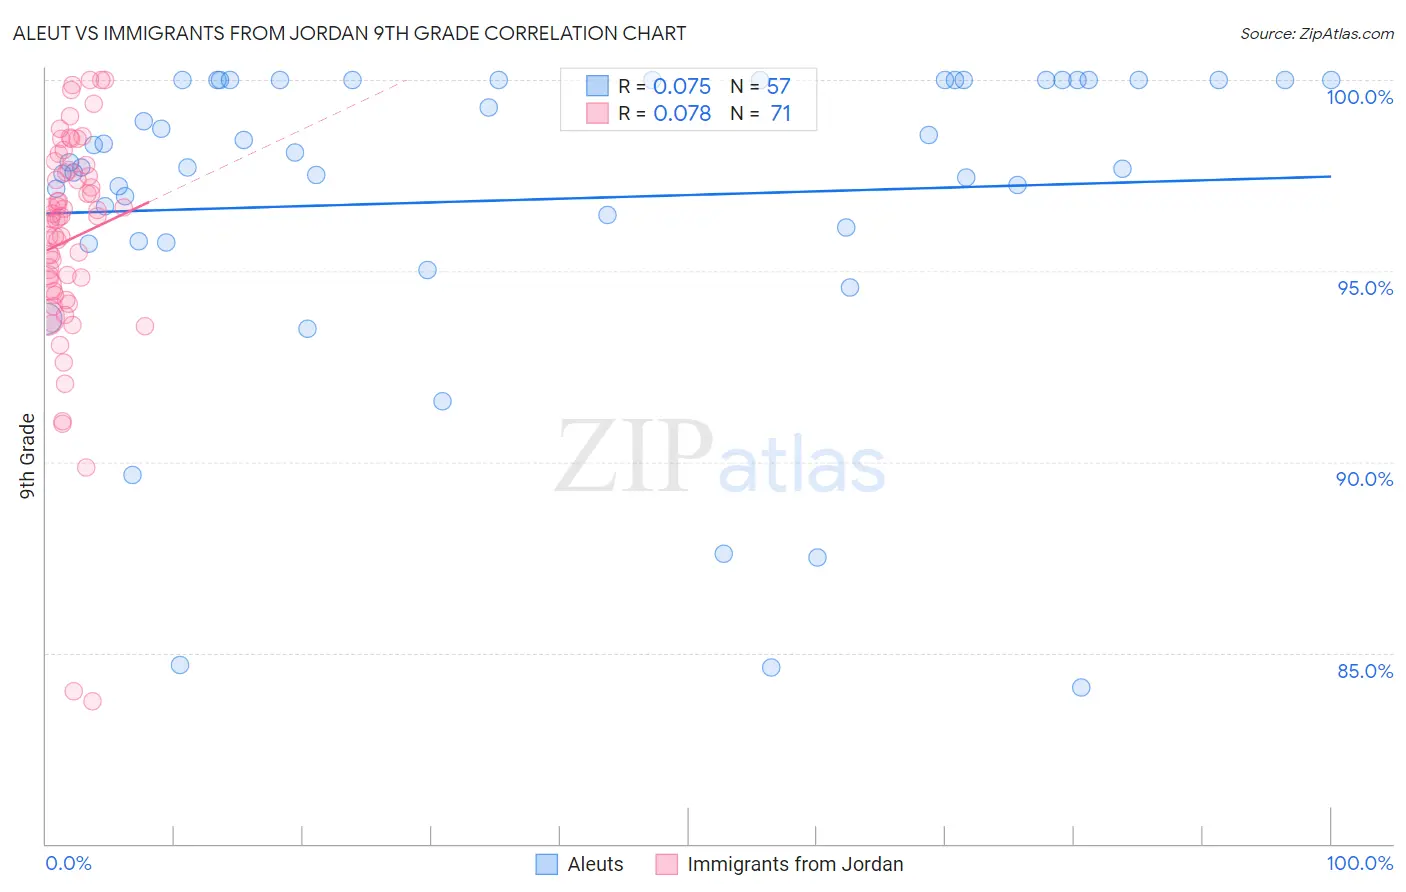
Aleut vs Immigrants from Jordan 9th Grade Correlation Chart
The statistical analysis conducted on geographies consisting of 61,782,786 people shows a slight positive correlation between the proportion of Aleuts and percentage of population with at least 9th grade education in the United States with a correlation coefficient (R) of 0.075 and weighted average of 96.0%. Similarly, the statistical analysis conducted on geographies consisting of 181,278,272 people shows a slight positive correlation between the proportion of Immigrants from Jordan and percentage of population with at least 9th grade education in the United States with a correlation coefficient (R) of 0.078 and weighted average of 95.1%, a difference of 0.88%.
9th Grade Correlation Summary
| Measurement | Aleut | Immigrants from Jordan |
| Minimum | 84.1% | 83.7% |
| Maximum | 100.0% | 100.0% |
| Range | 15.9% | 16.3% |
| Mean | 96.9% | 95.8% |
| Median | 97.8% | 96.4% |
| Interquartile 25% (IQ1) | 96.0% | 94.5% |
| Interquartile 75% (IQ3) | 100.0% | 97.6% |
| Interquartile Range (IQR) | 4.0% | 3.2% |
| Standard Deviation (Sample) | 4.2% | 3.0% |
| Standard Deviation (Population) | 4.1% | 3.0% |
Similar Demographics by 9th Grade
Demographics Similar to Aleuts by 9th Grade
In terms of 9th grade, the demographic groups most similar to Aleuts are Macedonian (96.0%, a difference of 0.0%), Immigrants from Austria (96.0%, a difference of 0.010%), Immigrants from North America (96.0%, a difference of 0.010%), New Zealander (95.9%, a difference of 0.020%), and Immigrants from Canada (96.0%, a difference of 0.030%).
| Demographics | Rating | Rank | 9th Grade |
| Immigrants | Northern Europe | 99.9 /100 | #51 | Exceptional 96.0% |
| Serbians | 99.9 /100 | #52 | Exceptional 96.0% |
| Austrians | 99.8 /100 | #53 | Exceptional 96.0% |
| Immigrants | Canada | 99.8 /100 | #54 | Exceptional 96.0% |
| Immigrants | Austria | 99.8 /100 | #55 | Exceptional 96.0% |
| Immigrants | North America | 99.8 /100 | #56 | Exceptional 96.0% |
| Macedonians | 99.8 /100 | #57 | Exceptional 96.0% |
| Aleuts | 99.8 /100 | #58 | Exceptional 96.0% |
| New Zealanders | 99.8 /100 | #59 | Exceptional 95.9% |
| Native Hawaiians | 99.8 /100 | #60 | Exceptional 95.9% |
| Sioux | 99.8 /100 | #61 | Exceptional 95.9% |
| Ukrainians | 99.7 /100 | #62 | Exceptional 95.9% |
| Canadians | 99.7 /100 | #63 | Exceptional 95.9% |
| Zimbabweans | 99.7 /100 | #64 | Exceptional 95.9% |
| Immigrants | England | 99.6 /100 | #65 | Exceptional 95.9% |
Demographics Similar to Immigrants from Jordan by 9th Grade
In terms of 9th grade, the demographic groups most similar to Immigrants from Jordan are Pueblo (95.1%, a difference of 0.010%), Immigrants from Sri Lanka (95.1%, a difference of 0.010%), Choctaw (95.1%, a difference of 0.010%), Immigrants from Korea (95.1%, a difference of 0.020%), and Kenyan (95.1%, a difference of 0.020%).
| Demographics | Rating | Rank | 9th Grade |
| Immigrants | Bosnia and Herzegovina | 85.2 /100 | #141 | Excellent 95.2% |
| Immigrants | Greece | 84.6 /100 | #142 | Excellent 95.2% |
| Spanish | 84.4 /100 | #143 | Excellent 95.2% |
| Yup'ik | 83.3 /100 | #144 | Excellent 95.2% |
| Pueblo | 82.2 /100 | #145 | Excellent 95.1% |
| Immigrants | Sri Lanka | 82.1 /100 | #146 | Excellent 95.1% |
| Choctaw | 81.9 /100 | #147 | Excellent 95.1% |
| Immigrants | Jordan | 81.2 /100 | #148 | Excellent 95.1% |
| Immigrants | Korea | 79.6 /100 | #149 | Good 95.1% |
| Kenyans | 79.1 /100 | #150 | Good 95.1% |
| Cajuns | 77.3 /100 | #151 | Good 95.1% |
| Ugandans | 77.0 /100 | #152 | Good 95.1% |
| Albanians | 76.1 /100 | #153 | Good 95.1% |
| Arabs | 74.9 /100 | #154 | Good 95.1% |
| Immigrants | Kazakhstan | 74.7 /100 | #155 | Good 95.1% |