Syrian vs Immigrants from China 9th Grade
COMPARE
Syrian
Immigrants from China
9th Grade
9th Grade Comparison
Syrians
Immigrants from China
95.5%
9TH GRADE
97.4/ 100
METRIC RATING
104th/ 347
METRIC RANK
94.3%
9TH GRADE
2.8/ 100
METRIC RATING
239th/ 347
METRIC RANK
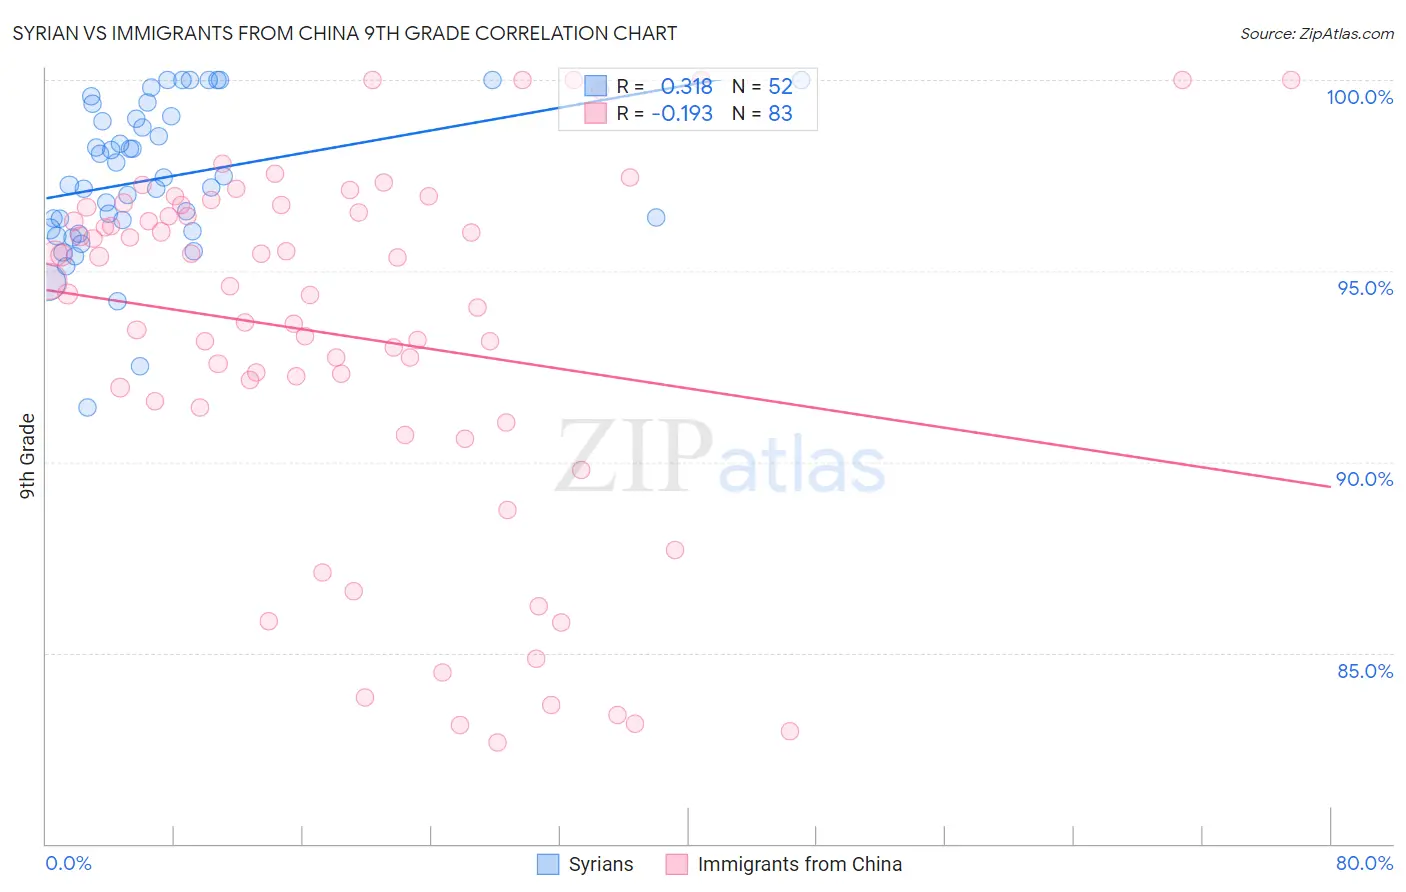
Syrian vs Immigrants from China 9th Grade Correlation Chart
The statistical analysis conducted on geographies consisting of 266,305,988 people shows a mild positive correlation between the proportion of Syrians and percentage of population with at least 9th grade education in the United States with a correlation coefficient (R) of 0.318 and weighted average of 95.5%. Similarly, the statistical analysis conducted on geographies consisting of 457,082,957 people shows a poor negative correlation between the proportion of Immigrants from China and percentage of population with at least 9th grade education in the United States with a correlation coefficient (R) of -0.193 and weighted average of 94.3%, a difference of 1.3%.
9th Grade Correlation Summary
| Measurement | Syrian | Immigrants from China |
| Minimum | 91.4% | 82.7% |
| Maximum | 100.0% | 100.0% |
| Range | 8.6% | 17.3% |
| Mean | 97.4% | 93.3% |
| Median | 97.3% | 94.6% |
| Interquartile 25% (IQ1) | 96.1% | 91.4% |
| Interquartile 75% (IQ3) | 99.0% | 96.7% |
| Interquartile Range (IQR) | 2.9% | 5.3% |
| Standard Deviation (Sample) | 2.0% | 4.8% |
| Standard Deviation (Population) | 2.0% | 4.7% |
Similar Demographics by 9th Grade
Demographics Similar to Syrians by 9th Grade
In terms of 9th grade, the demographic groups most similar to Syrians are Immigrants from France (95.5%, a difference of 0.0%), Potawatomi (95.5%, a difference of 0.020%), Immigrants from Norway (95.5%, a difference of 0.020%), Immigrants from Switzerland (95.5%, a difference of 0.030%), and Immigrants from Zimbabwe (95.5%, a difference of 0.030%).
| Demographics | Rating | Rank | 9th Grade |
| Delaware | 98.4 /100 | #97 | Exceptional 95.6% |
| Immigrants | Japan | 98.4 /100 | #98 | Exceptional 95.6% |
| Menominee | 98.3 /100 | #99 | Exceptional 95.6% |
| Lebanese | 98.1 /100 | #100 | Exceptional 95.6% |
| Immigrants | Moldova | 97.9 /100 | #101 | Exceptional 95.5% |
| Immigrants | Switzerland | 97.7 /100 | #102 | Exceptional 95.5% |
| Potawatomi | 97.7 /100 | #103 | Exceptional 95.5% |
| Syrians | 97.4 /100 | #104 | Exceptional 95.5% |
| Immigrants | France | 97.4 /100 | #105 | Exceptional 95.5% |
| Immigrants | Norway | 97.1 /100 | #106 | Exceptional 95.5% |
| Immigrants | Zimbabwe | 96.9 /100 | #107 | Exceptional 95.5% |
| Chickasaw | 96.8 /100 | #108 | Exceptional 95.5% |
| Osage | 96.8 /100 | #109 | Exceptional 95.5% |
| Immigrants | Bulgaria | 96.7 /100 | #110 | Exceptional 95.5% |
| Cherokee | 96.3 /100 | #111 | Exceptional 95.4% |
Demographics Similar to Immigrants from China by 9th Grade
In terms of 9th grade, the demographic groups most similar to Immigrants from China are Korean (94.3%, a difference of 0.0%), South American Indian (94.3%, a difference of 0.0%), Somali (94.3%, a difference of 0.010%), Immigrants from Ethiopia (94.3%, a difference of 0.010%), and Spanish American (94.2%, a difference of 0.010%).
| Demographics | Rating | Rank | 9th Grade |
| Immigrants | Africa | 3.9 /100 | #232 | Tragic 94.3% |
| Nigerians | 3.7 /100 | #233 | Tragic 94.3% |
| Costa Ricans | 3.5 /100 | #234 | Tragic 94.3% |
| Bolivians | 3.3 /100 | #235 | Tragic 94.3% |
| Somalis | 2.9 /100 | #236 | Tragic 94.3% |
| Koreans | 2.9 /100 | #237 | Tragic 94.3% |
| South American Indians | 2.8 /100 | #238 | Tragic 94.3% |
| Immigrants | China | 2.8 /100 | #239 | Tragic 94.3% |
| Immigrants | Ethiopia | 2.7 /100 | #240 | Tragic 94.3% |
| Spanish Americans | 2.6 /100 | #241 | Tragic 94.2% |
| Immigrants | Middle Africa | 2.2 /100 | #242 | Tragic 94.2% |
| Immigrants | Cameroon | 2.1 /100 | #243 | Tragic 94.2% |
| Dutch West Indians | 2.0 /100 | #244 | Tragic 94.2% |
| Paiute | 1.9 /100 | #245 | Tragic 94.2% |
| Senegalese | 1.9 /100 | #246 | Tragic 94.2% |