Aleut vs Immigrants from Hungary 9th Grade
COMPARE
Aleut
Immigrants from Hungary
9th Grade
9th Grade Comparison
Aleuts
Immigrants from Hungary
96.0%
9TH GRADE
99.8/ 100
METRIC RATING
58th/ 347
METRIC RANK
95.4%
9TH GRADE
94.2/ 100
METRIC RATING
128th/ 347
METRIC RANK
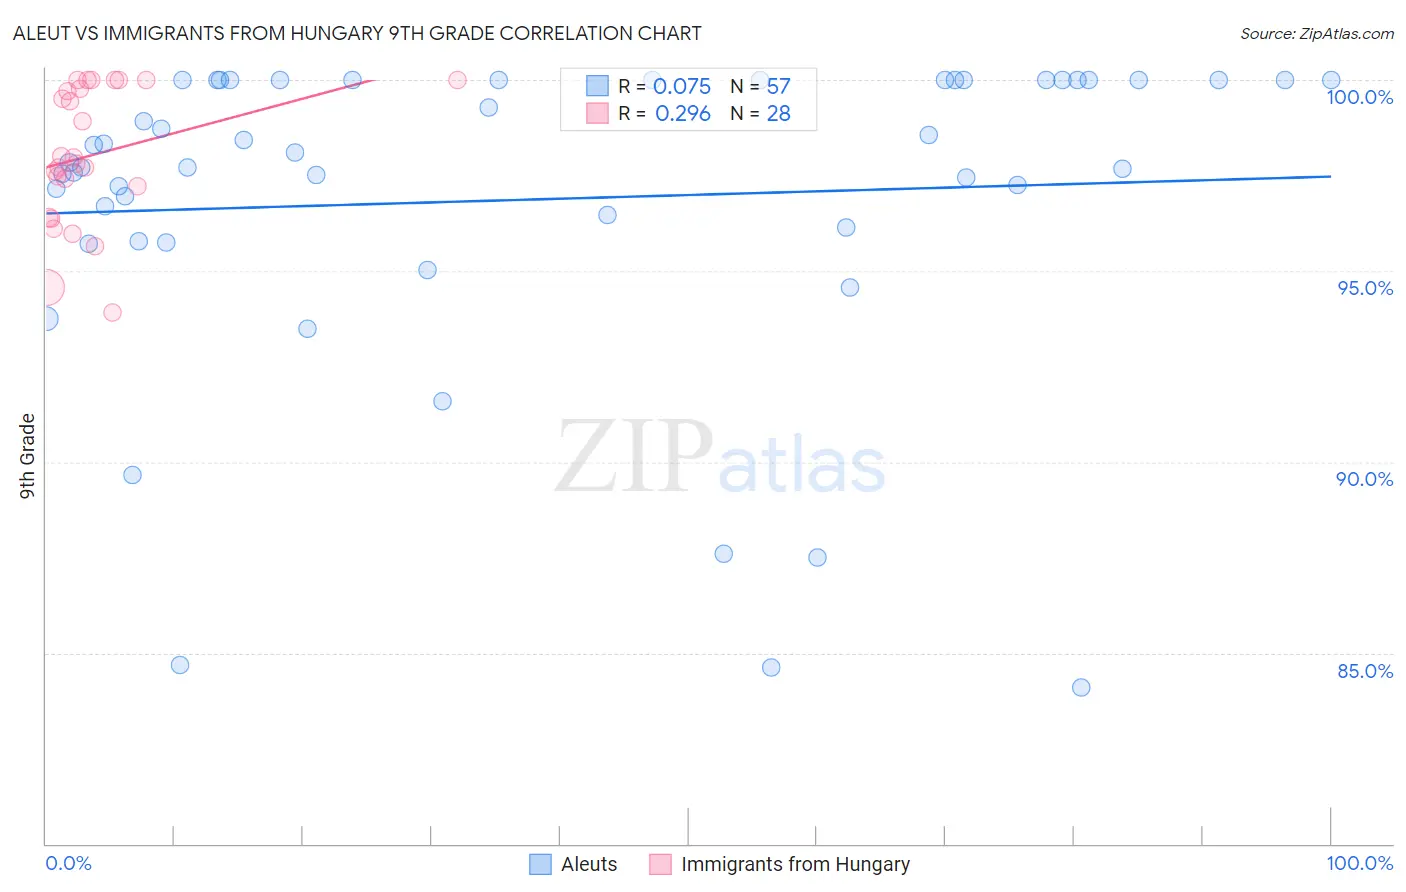
Aleut vs Immigrants from Hungary 9th Grade Correlation Chart
The statistical analysis conducted on geographies consisting of 61,782,786 people shows a slight positive correlation between the proportion of Aleuts and percentage of population with at least 9th grade education in the United States with a correlation coefficient (R) of 0.075 and weighted average of 96.0%. Similarly, the statistical analysis conducted on geographies consisting of 195,707,305 people shows a weak positive correlation between the proportion of Immigrants from Hungary and percentage of population with at least 9th grade education in the United States with a correlation coefficient (R) of 0.296 and weighted average of 95.4%, a difference of 0.63%.
9th Grade Correlation Summary
| Measurement | Aleut | Immigrants from Hungary |
| Minimum | 84.1% | 93.9% |
| Maximum | 100.0% | 100.0% |
| Range | 15.9% | 6.1% |
| Mean | 96.9% | 98.0% |
| Median | 97.8% | 97.9% |
| Interquartile 25% (IQ1) | 96.0% | 96.8% |
| Interquartile 75% (IQ3) | 100.0% | 99.9% |
| Interquartile Range (IQR) | 4.0% | 3.1% |
| Standard Deviation (Sample) | 4.2% | 1.8% |
| Standard Deviation (Population) | 4.1% | 1.8% |
Similar Demographics by 9th Grade
Demographics Similar to Aleuts by 9th Grade
In terms of 9th grade, the demographic groups most similar to Aleuts are Macedonian (96.0%, a difference of 0.0%), Immigrants from Austria (96.0%, a difference of 0.010%), Immigrants from North America (96.0%, a difference of 0.010%), New Zealander (95.9%, a difference of 0.020%), and Immigrants from Canada (96.0%, a difference of 0.030%).
| Demographics | Rating | Rank | 9th Grade |
| Immigrants | Northern Europe | 99.9 /100 | #51 | Exceptional 96.0% |
| Serbians | 99.9 /100 | #52 | Exceptional 96.0% |
| Austrians | 99.8 /100 | #53 | Exceptional 96.0% |
| Immigrants | Canada | 99.8 /100 | #54 | Exceptional 96.0% |
| Immigrants | Austria | 99.8 /100 | #55 | Exceptional 96.0% |
| Immigrants | North America | 99.8 /100 | #56 | Exceptional 96.0% |
| Macedonians | 99.8 /100 | #57 | Exceptional 96.0% |
| Aleuts | 99.8 /100 | #58 | Exceptional 96.0% |
| New Zealanders | 99.8 /100 | #59 | Exceptional 95.9% |
| Native Hawaiians | 99.8 /100 | #60 | Exceptional 95.9% |
| Sioux | 99.8 /100 | #61 | Exceptional 95.9% |
| Ukrainians | 99.7 /100 | #62 | Exceptional 95.9% |
| Canadians | 99.7 /100 | #63 | Exceptional 95.9% |
| Zimbabweans | 99.7 /100 | #64 | Exceptional 95.9% |
| Immigrants | England | 99.6 /100 | #65 | Exceptional 95.9% |
Demographics Similar to Immigrants from Hungary by 9th Grade
In terms of 9th grade, the demographic groups most similar to Immigrants from Hungary are Palestinian (95.4%, a difference of 0.0%), Basque (95.4%, a difference of 0.0%), Immigrants from Serbia (95.4%, a difference of 0.010%), Jordanian (95.3%, a difference of 0.020%), and Immigrants from South Central Asia (95.4%, a difference of 0.030%).
| Demographics | Rating | Rank | 9th Grade |
| Cree | 95.5 /100 | #121 | Exceptional 95.4% |
| Immigrants | Kuwait | 95.5 /100 | #122 | Exceptional 95.4% |
| Kiowa | 95.3 /100 | #123 | Exceptional 95.4% |
| Shoshone | 95.3 /100 | #124 | Exceptional 95.4% |
| Immigrants | South Central Asia | 95.1 /100 | #125 | Exceptional 95.4% |
| Immigrants | Serbia | 94.4 /100 | #126 | Exceptional 95.4% |
| Palestinians | 94.3 /100 | #127 | Exceptional 95.4% |
| Immigrants | Hungary | 94.2 /100 | #128 | Exceptional 95.4% |
| Basques | 94.1 /100 | #129 | Exceptional 95.4% |
| Jordanians | 93.5 /100 | #130 | Exceptional 95.3% |
| Immigrants | North Macedonia | 92.3 /100 | #131 | Exceptional 95.3% |
| Immigrants | Nonimmigrants | 92.0 /100 | #132 | Exceptional 95.3% |
| Israelis | 90.4 /100 | #133 | Exceptional 95.3% |
| Immigrants | Israel | 89.6 /100 | #134 | Excellent 95.3% |
| Immigrants | Belarus | 88.9 /100 | #135 | Excellent 95.2% |