Australian vs Immigrants from China 9th Grade
COMPARE
Australian
Immigrants from China
9th Grade
9th Grade Comparison
Australians
Immigrants from China
96.0%
9TH GRADE
99.9/ 100
METRIC RATING
48th/ 347
METRIC RANK
94.3%
9TH GRADE
2.8/ 100
METRIC RATING
239th/ 347
METRIC RANK
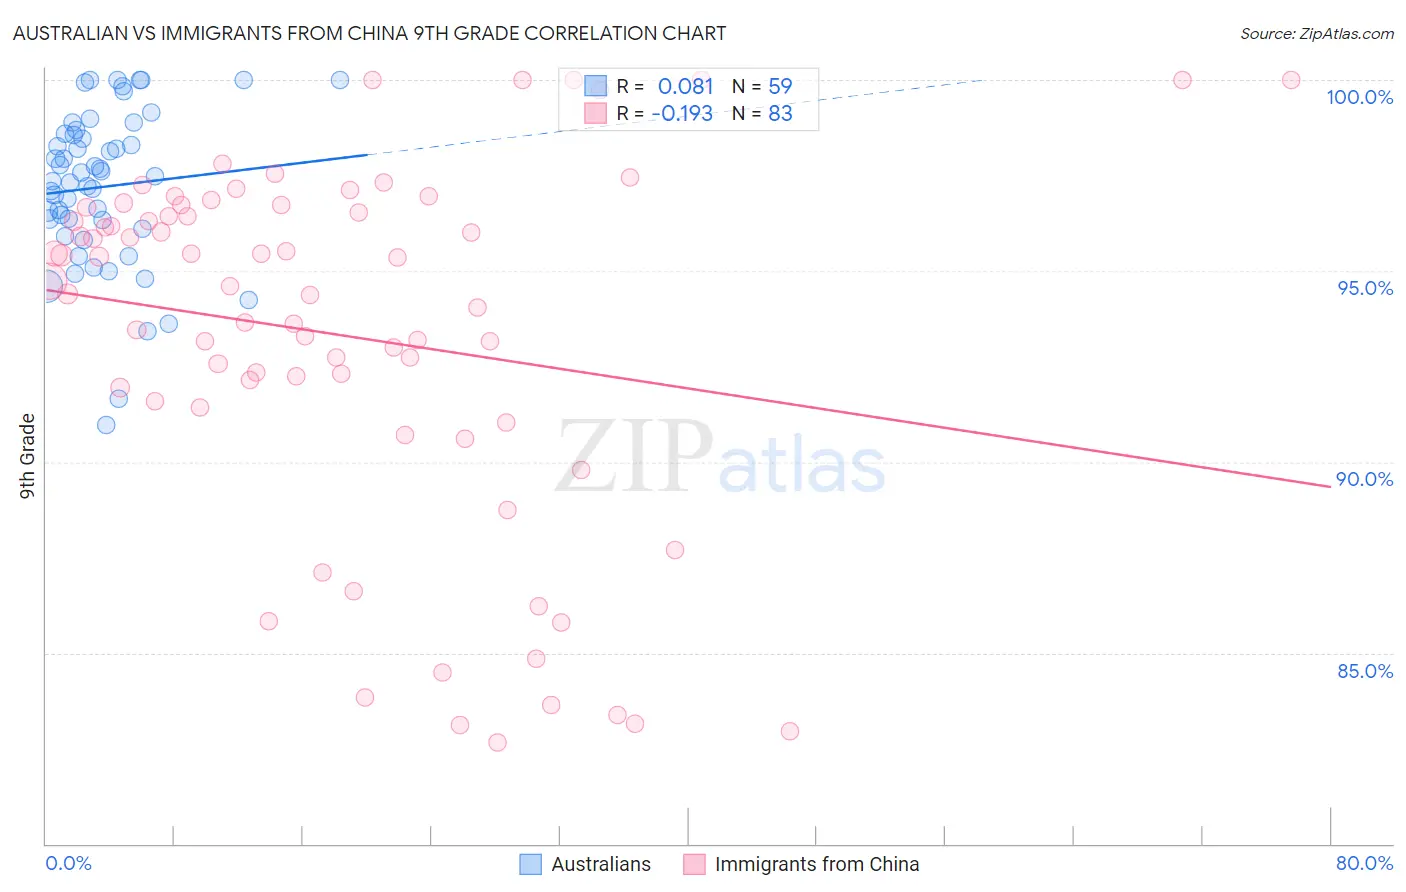
Australian vs Immigrants from China 9th Grade Correlation Chart
The statistical analysis conducted on geographies consisting of 224,153,693 people shows a slight positive correlation between the proportion of Australians and percentage of population with at least 9th grade education in the United States with a correlation coefficient (R) of 0.081 and weighted average of 96.0%. Similarly, the statistical analysis conducted on geographies consisting of 457,082,957 people shows a poor negative correlation between the proportion of Immigrants from China and percentage of population with at least 9th grade education in the United States with a correlation coefficient (R) of -0.193 and weighted average of 94.3%, a difference of 1.9%.
9th Grade Correlation Summary
| Measurement | Australian | Immigrants from China |
| Minimum | 91.0% | 82.7% |
| Maximum | 100.0% | 100.0% |
| Range | 9.0% | 17.3% |
| Mean | 97.2% | 93.3% |
| Median | 97.5% | 94.6% |
| Interquartile 25% (IQ1) | 96.1% | 91.4% |
| Interquartile 75% (IQ3) | 98.6% | 96.7% |
| Interquartile Range (IQR) | 2.5% | 5.3% |
| Standard Deviation (Sample) | 2.0% | 4.8% |
| Standard Deviation (Population) | 2.0% | 4.7% |
Similar Demographics by 9th Grade
Demographics Similar to Australians by 9th Grade
In terms of 9th grade, the demographic groups most similar to Australians are Russian (96.0%, a difference of 0.0%), Crow (96.1%, a difference of 0.010%), Immigrants from India (96.1%, a difference of 0.010%), Greek (96.0%, a difference of 0.010%), and Alaska Native (96.1%, a difference of 0.020%).
| Demographics | Rating | Rank | 9th Grade |
| Czechoslovakians | 99.9 /100 | #41 | Exceptional 96.1% |
| Chippewa | 99.9 /100 | #42 | Exceptional 96.1% |
| Iranians | 99.9 /100 | #43 | Exceptional 96.1% |
| Alaska Natives | 99.9 /100 | #44 | Exceptional 96.1% |
| Crow | 99.9 /100 | #45 | Exceptional 96.1% |
| Immigrants | India | 99.9 /100 | #46 | Exceptional 96.1% |
| Russians | 99.9 /100 | #47 | Exceptional 96.0% |
| Australians | 99.9 /100 | #48 | Exceptional 96.0% |
| Greeks | 99.9 /100 | #49 | Exceptional 96.0% |
| Celtics | 99.9 /100 | #50 | Exceptional 96.0% |
| Immigrants | Northern Europe | 99.9 /100 | #51 | Exceptional 96.0% |
| Serbians | 99.9 /100 | #52 | Exceptional 96.0% |
| Austrians | 99.8 /100 | #53 | Exceptional 96.0% |
| Immigrants | Canada | 99.8 /100 | #54 | Exceptional 96.0% |
| Immigrants | Austria | 99.8 /100 | #55 | Exceptional 96.0% |
Demographics Similar to Immigrants from China by 9th Grade
In terms of 9th grade, the demographic groups most similar to Immigrants from China are Korean (94.3%, a difference of 0.0%), South American Indian (94.3%, a difference of 0.0%), Somali (94.3%, a difference of 0.010%), Immigrants from Ethiopia (94.3%, a difference of 0.010%), and Spanish American (94.2%, a difference of 0.010%).
| Demographics | Rating | Rank | 9th Grade |
| Immigrants | Africa | 3.9 /100 | #232 | Tragic 94.3% |
| Nigerians | 3.7 /100 | #233 | Tragic 94.3% |
| Costa Ricans | 3.5 /100 | #234 | Tragic 94.3% |
| Bolivians | 3.3 /100 | #235 | Tragic 94.3% |
| Somalis | 2.9 /100 | #236 | Tragic 94.3% |
| Koreans | 2.9 /100 | #237 | Tragic 94.3% |
| South American Indians | 2.8 /100 | #238 | Tragic 94.3% |
| Immigrants | China | 2.8 /100 | #239 | Tragic 94.3% |
| Immigrants | Ethiopia | 2.7 /100 | #240 | Tragic 94.3% |
| Spanish Americans | 2.6 /100 | #241 | Tragic 94.2% |
| Immigrants | Middle Africa | 2.2 /100 | #242 | Tragic 94.2% |
| Immigrants | Cameroon | 2.1 /100 | #243 | Tragic 94.2% |
| Dutch West Indians | 2.0 /100 | #244 | Tragic 94.2% |
| Paiute | 1.9 /100 | #245 | Tragic 94.2% |
| Senegalese | 1.9 /100 | #246 | Tragic 94.2% |