Fijian vs Immigrants from China 9th Grade
COMPARE
Fijian
Immigrants from China
9th Grade
9th Grade Comparison
Fijians
Immigrants from China
93.1%
9TH GRADE
0.0/ 100
METRIC RATING
297th/ 347
METRIC RANK
94.3%
9TH GRADE
2.8/ 100
METRIC RATING
239th/ 347
METRIC RANK
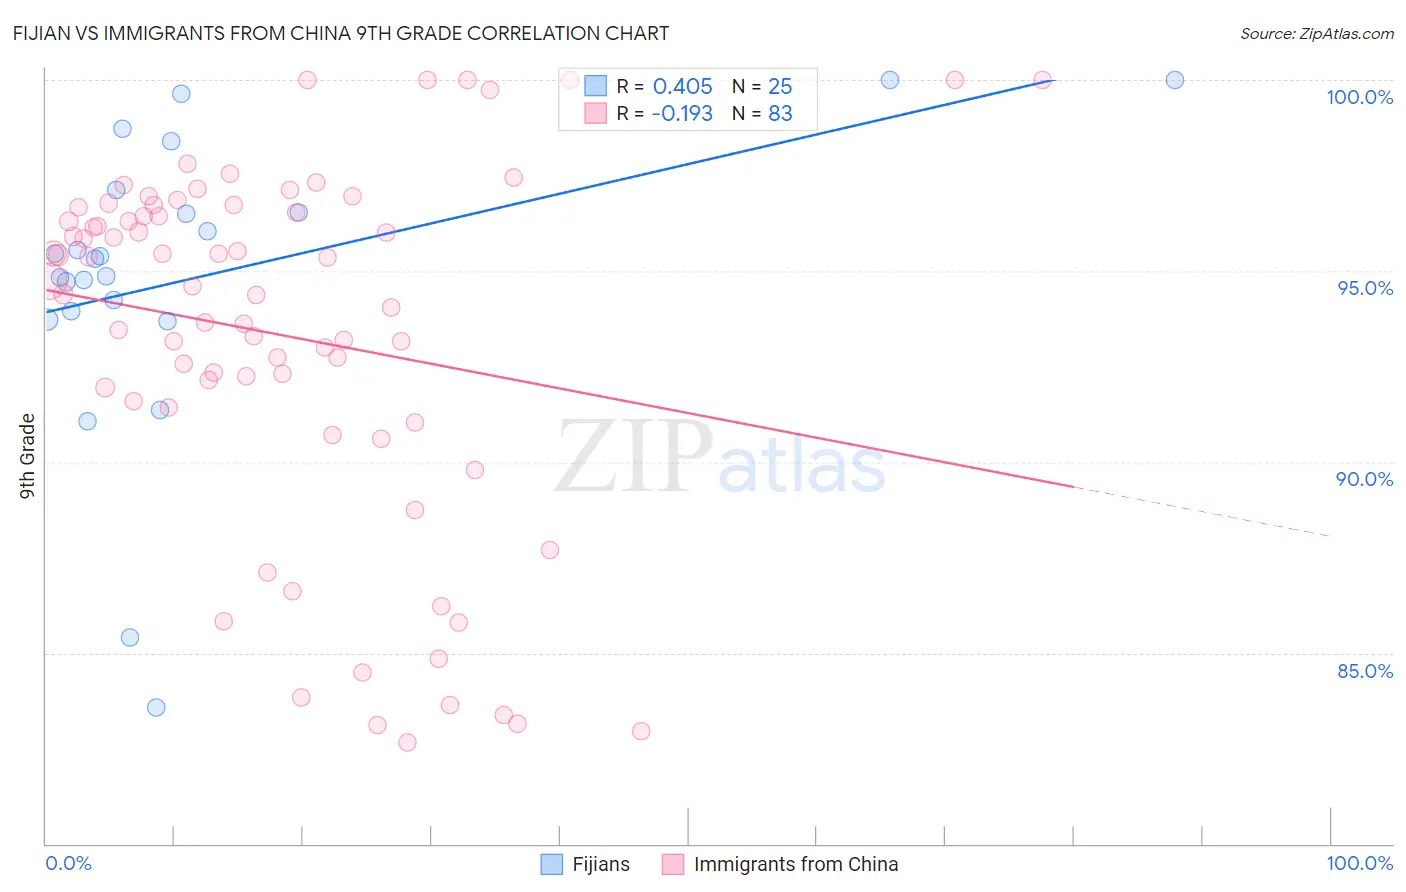
Fijian vs Immigrants from China 9th Grade Correlation Chart
The statistical analysis conducted on geographies consisting of 55,948,842 people shows a moderate positive correlation between the proportion of Fijians and percentage of population with at least 9th grade education in the United States with a correlation coefficient (R) of 0.405 and weighted average of 93.1%. Similarly, the statistical analysis conducted on geographies consisting of 457,082,957 people shows a poor negative correlation between the proportion of Immigrants from China and percentage of population with at least 9th grade education in the United States with a correlation coefficient (R) of -0.193 and weighted average of 94.3%, a difference of 1.2%.
9th Grade Correlation Summary
| Measurement | Fijian | Immigrants from China |
| Minimum | 83.6% | 82.7% |
| Maximum | 100.0% | 100.0% |
| Range | 16.4% | 17.3% |
| Mean | 94.8% | 93.3% |
| Median | 95.3% | 94.6% |
| Interquartile 25% (IQ1) | 93.8% | 91.4% |
| Interquartile 75% (IQ3) | 96.8% | 96.7% |
| Interquartile Range (IQR) | 3.0% | 5.3% |
| Standard Deviation (Sample) | 3.9% | 4.8% |
| Standard Deviation (Population) | 3.8% | 4.7% |
Similar Demographics by 9th Grade
Demographics Similar to Fijians by 9th Grade
In terms of 9th grade, the demographic groups most similar to Fijians are Immigrants from Burma/Myanmar (93.1%, a difference of 0.030%), Indonesian (93.1%, a difference of 0.030%), Haitian (93.1%, a difference of 0.030%), Cuban (93.2%, a difference of 0.050%), and Sri Lankan (93.2%, a difference of 0.060%).
| Demographics | Rating | Rank | 9th Grade |
| Pennsylvania Germans | 0.0 /100 | #290 | Tragic 93.3% |
| British West Indians | 0.0 /100 | #291 | Tragic 93.2% |
| Immigrants | Laos | 0.0 /100 | #292 | Tragic 93.2% |
| Sri Lankans | 0.0 /100 | #293 | Tragic 93.2% |
| Cubans | 0.0 /100 | #294 | Tragic 93.2% |
| Immigrants | Burma/Myanmar | 0.0 /100 | #295 | Tragic 93.1% |
| Indonesians | 0.0 /100 | #296 | Tragic 93.1% |
| Fijians | 0.0 /100 | #297 | Tragic 93.1% |
| Haitians | 0.0 /100 | #298 | Tragic 93.1% |
| Immigrants | Grenada | 0.0 /100 | #299 | Tragic 93.0% |
| Yaqui | 0.0 /100 | #300 | Tragic 92.9% |
| Immigrants | Haiti | 0.0 /100 | #301 | Tragic 92.7% |
| Immigrants | Dominica | 0.0 /100 | #302 | Tragic 92.7% |
| Guyanese | 0.0 /100 | #303 | Tragic 92.7% |
| Tohono O'odham | 0.0 /100 | #304 | Tragic 92.6% |
Demographics Similar to Immigrants from China by 9th Grade
In terms of 9th grade, the demographic groups most similar to Immigrants from China are Korean (94.3%, a difference of 0.0%), South American Indian (94.3%, a difference of 0.0%), Somali (94.3%, a difference of 0.010%), Immigrants from Ethiopia (94.3%, a difference of 0.010%), and Spanish American (94.2%, a difference of 0.010%).
| Demographics | Rating | Rank | 9th Grade |
| Immigrants | Africa | 3.9 /100 | #232 | Tragic 94.3% |
| Nigerians | 3.7 /100 | #233 | Tragic 94.3% |
| Costa Ricans | 3.5 /100 | #234 | Tragic 94.3% |
| Bolivians | 3.3 /100 | #235 | Tragic 94.3% |
| Somalis | 2.9 /100 | #236 | Tragic 94.3% |
| Koreans | 2.9 /100 | #237 | Tragic 94.3% |
| South American Indians | 2.8 /100 | #238 | Tragic 94.3% |
| Immigrants | China | 2.8 /100 | #239 | Tragic 94.3% |
| Immigrants | Ethiopia | 2.7 /100 | #240 | Tragic 94.3% |
| Spanish Americans | 2.6 /100 | #241 | Tragic 94.2% |
| Immigrants | Middle Africa | 2.2 /100 | #242 | Tragic 94.2% |
| Immigrants | Cameroon | 2.1 /100 | #243 | Tragic 94.2% |
| Dutch West Indians | 2.0 /100 | #244 | Tragic 94.2% |
| Paiute | 1.9 /100 | #245 | Tragic 94.2% |
| Senegalese | 1.9 /100 | #246 | Tragic 94.2% |