Albanian vs Tlingit-Haida Bachelor's Degree
COMPARE
Albanian
Tlingit-Haida
Bachelor's Degree
Bachelor's Degree Comparison
Albanians
Tlingit-Haida
40.9%
BACHELOR'S DEGREE
96.5/ 100
METRIC RATING
110th/ 347
METRIC RANK
34.6%
BACHELOR'S DEGREE
2.8/ 100
METRIC RATING
237th/ 347
METRIC RANK
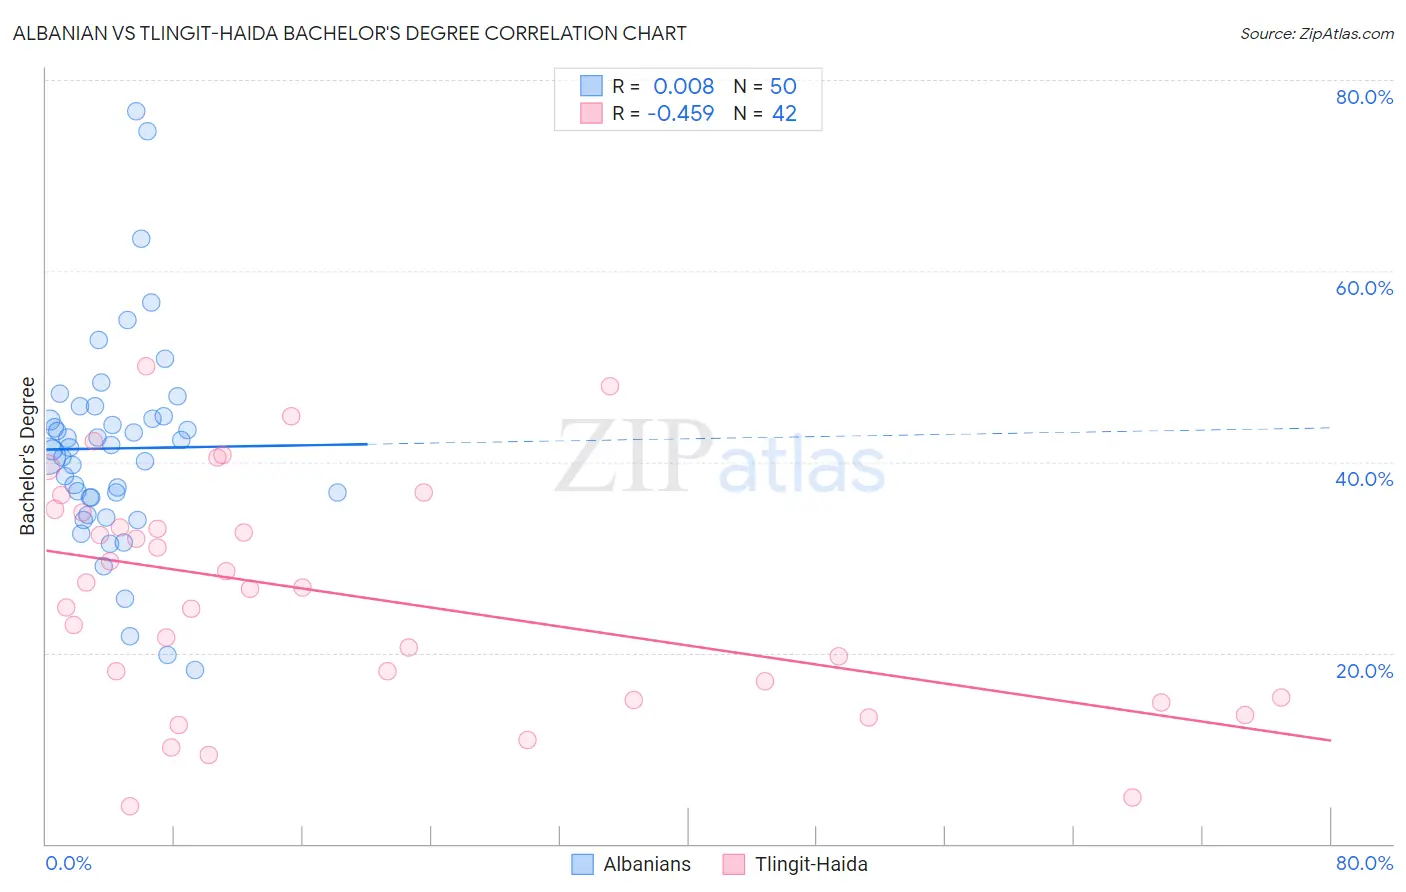
Albanian vs Tlingit-Haida Bachelor's Degree Correlation Chart
The statistical analysis conducted on geographies consisting of 193,245,507 people shows no correlation between the proportion of Albanians and percentage of population with at least bachelor's degree education in the United States with a correlation coefficient (R) of 0.008 and weighted average of 40.9%. Similarly, the statistical analysis conducted on geographies consisting of 60,872,339 people shows a moderate negative correlation between the proportion of Tlingit-Haida and percentage of population with at least bachelor's degree education in the United States with a correlation coefficient (R) of -0.459 and weighted average of 34.6%, a difference of 18.3%.
Bachelor's Degree Correlation Summary
| Measurement | Albanian | Tlingit-Haida |
| Minimum | 18.2% | 4.0% |
| Maximum | 76.7% | 50.0% |
| Range | 58.4% | 46.0% |
| Mean | 41.4% | 26.0% |
| Median | 41.4% | 26.8% |
| Interquartile 25% (IQ1) | 36.3% | 15.4% |
| Interquartile 75% (IQ3) | 44.8% | 34.8% |
| Interquartile Range (IQR) | 8.5% | 19.4% |
| Standard Deviation (Sample) | 11.2% | 11.9% |
| Standard Deviation (Population) | 11.1% | 11.7% |
Similar Demographics by Bachelor's Degree
Demographics Similar to Albanians by Bachelor's Degree
In terms of bachelor's degree, the demographic groups most similar to Albanians are Immigrants from Chile (40.8%, a difference of 0.050%), Arab (40.9%, a difference of 0.080%), Ukrainian (40.9%, a difference of 0.090%), Ugandan (40.8%, a difference of 0.090%), and Brazilian (40.8%, a difference of 0.14%).
| Demographics | Rating | Rank | Bachelor's Degree |
| Chileans | 97.5 /100 | #103 | Exceptional 41.2% |
| Jordanians | 97.4 /100 | #104 | Exceptional 41.2% |
| Syrians | 97.4 /100 | #105 | Exceptional 41.1% |
| Alsatians | 97.0 /100 | #106 | Exceptional 41.0% |
| Northern Europeans | 96.8 /100 | #107 | Exceptional 41.0% |
| Ukrainians | 96.6 /100 | #108 | Exceptional 40.9% |
| Arabs | 96.6 /100 | #109 | Exceptional 40.9% |
| Albanians | 96.5 /100 | #110 | Exceptional 40.9% |
| Immigrants | Chile | 96.4 /100 | #111 | Exceptional 40.8% |
| Ugandans | 96.3 /100 | #112 | Exceptional 40.8% |
| Brazilians | 96.3 /100 | #113 | Exceptional 40.8% |
| Afghans | 96.2 /100 | #114 | Exceptional 40.8% |
| Palestinians | 95.8 /100 | #115 | Exceptional 40.7% |
| Immigrants | Uganda | 95.7 /100 | #116 | Exceptional 40.7% |
| Austrians | 95.5 /100 | #117 | Exceptional 40.6% |
Demographics Similar to Tlingit-Haida by Bachelor's Degree
In terms of bachelor's degree, the demographic groups most similar to Tlingit-Haida are Liberian (34.6%, a difference of 0.040%), Immigrants from West Indies (34.6%, a difference of 0.14%), Guamanian/Chamorro (34.6%, a difference of 0.24%), Guyanese (34.5%, a difference of 0.28%), and British West Indian (34.5%, a difference of 0.30%).
| Demographics | Rating | Rank | Bachelor's Degree |
| Immigrants | Grenada | 4.3 /100 | #230 | Tragic 35.0% |
| Immigrants | St. Vincent and the Grenadines | 4.3 /100 | #231 | Tragic 35.0% |
| Hmong | 3.4 /100 | #232 | Tragic 34.8% |
| Immigrants | Ecuador | 3.3 /100 | #233 | Tragic 34.7% |
| Guamanians/Chamorros | 3.0 /100 | #234 | Tragic 34.6% |
| Immigrants | West Indies | 2.9 /100 | #235 | Tragic 34.6% |
| Liberians | 2.8 /100 | #236 | Tragic 34.6% |
| Tlingit-Haida | 2.8 /100 | #237 | Tragic 34.6% |
| Guyanese | 2.5 /100 | #238 | Tragic 34.5% |
| British West Indians | 2.5 /100 | #239 | Tragic 34.5% |
| Tongans | 2.0 /100 | #240 | Tragic 34.3% |
| Immigrants | Cambodia | 1.9 /100 | #241 | Tragic 34.2% |
| Immigrants | Nonimmigrants | 1.8 /100 | #242 | Tragic 34.2% |
| Immigrants | Guyana | 1.4 /100 | #243 | Tragic 33.9% |
| Delaware | 1.2 /100 | #244 | Tragic 33.8% |