Albanian vs Moroccan Bachelor's Degree
COMPARE
Albanian
Moroccan
Bachelor's Degree
Bachelor's Degree Comparison
Albanians
Moroccans
40.9%
BACHELOR'S DEGREE
96.5/ 100
METRIC RATING
110th/ 347
METRIC RANK
40.5%
BACHELOR'S DEGREE
94.6/ 100
METRIC RATING
121st/ 347
METRIC RANK
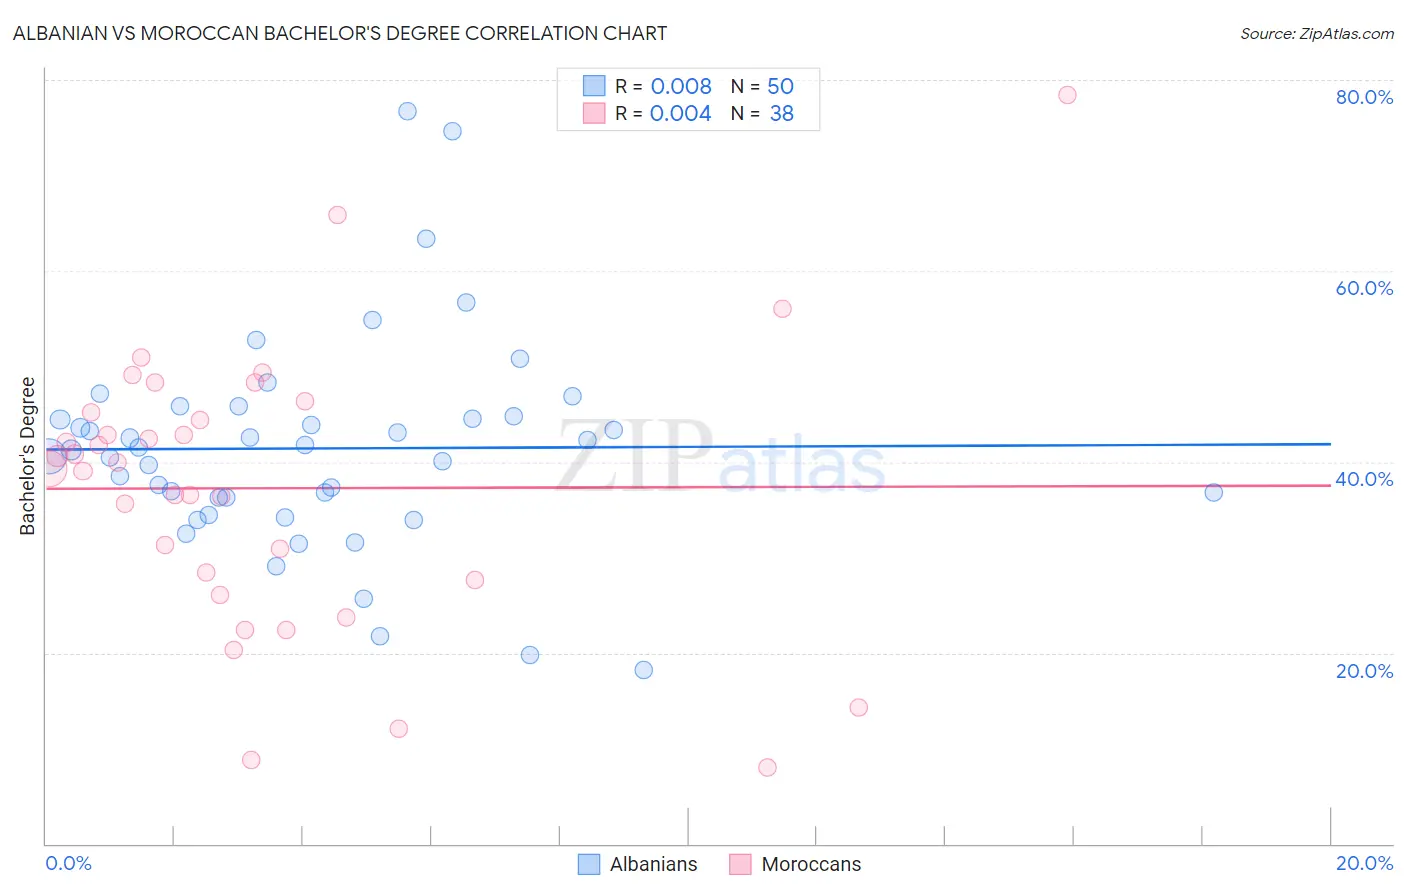
Albanian vs Moroccan Bachelor's Degree Correlation Chart
The statistical analysis conducted on geographies consisting of 193,245,507 people shows no correlation between the proportion of Albanians and percentage of population with at least bachelor's degree education in the United States with a correlation coefficient (R) of 0.008 and weighted average of 40.9%. Similarly, the statistical analysis conducted on geographies consisting of 201,813,734 people shows no correlation between the proportion of Moroccans and percentage of population with at least bachelor's degree education in the United States with a correlation coefficient (R) of 0.004 and weighted average of 40.5%, a difference of 1.0%.
Bachelor's Degree Correlation Summary
| Measurement | Albanian | Moroccan |
| Minimum | 18.2% | 7.9% |
| Maximum | 76.7% | 78.5% |
| Range | 58.4% | 70.5% |
| Mean | 41.4% | 37.2% |
| Median | 41.4% | 39.6% |
| Interquartile 25% (IQ1) | 36.3% | 27.6% |
| Interquartile 75% (IQ3) | 44.8% | 45.2% |
| Interquartile Range (IQR) | 8.5% | 17.6% |
| Standard Deviation (Sample) | 11.2% | 14.8% |
| Standard Deviation (Population) | 11.1% | 14.6% |
Demographics Similar to Albanians and Moroccans by Bachelor's Degree
In terms of bachelor's degree, the demographic groups most similar to Albanians are Immigrants from Chile (40.8%, a difference of 0.050%), Arab (40.9%, a difference of 0.080%), Ukrainian (40.9%, a difference of 0.090%), Ugandan (40.8%, a difference of 0.090%), and Brazilian (40.8%, a difference of 0.14%). Similarly, the demographic groups most similar to Moroccans are Venezuelan (40.5%, a difference of 0.050%), Immigrants from Albania (40.4%, a difference of 0.10%), Immigrants from Syria (40.5%, a difference of 0.12%), Lebanese (40.4%, a difference of 0.12%), and Immigrants from Eritrea (40.4%, a difference of 0.12%).
| Demographics | Rating | Rank | Bachelor's Degree |
| Syrians | 97.4 /100 | #105 | Exceptional 41.1% |
| Alsatians | 97.0 /100 | #106 | Exceptional 41.0% |
| Northern Europeans | 96.8 /100 | #107 | Exceptional 41.0% |
| Ukrainians | 96.6 /100 | #108 | Exceptional 40.9% |
| Arabs | 96.6 /100 | #109 | Exceptional 40.9% |
| Albanians | 96.5 /100 | #110 | Exceptional 40.9% |
| Immigrants | Chile | 96.4 /100 | #111 | Exceptional 40.8% |
| Ugandans | 96.3 /100 | #112 | Exceptional 40.8% |
| Brazilians | 96.3 /100 | #113 | Exceptional 40.8% |
| Afghans | 96.2 /100 | #114 | Exceptional 40.8% |
| Palestinians | 95.8 /100 | #115 | Exceptional 40.7% |
| Immigrants | Uganda | 95.7 /100 | #116 | Exceptional 40.7% |
| Austrians | 95.5 /100 | #117 | Exceptional 40.6% |
| Croatians | 95.5 /100 | #118 | Exceptional 40.6% |
| Immigrants | Syria | 94.9 /100 | #119 | Exceptional 40.5% |
| Venezuelans | 94.7 /100 | #120 | Exceptional 40.5% |
| Moroccans | 94.6 /100 | #121 | Exceptional 40.5% |
| Immigrants | Albania | 94.4 /100 | #122 | Exceptional 40.4% |
| Lebanese | 94.3 /100 | #123 | Exceptional 40.4% |
| Immigrants | Eritrea | 94.3 /100 | #124 | Exceptional 40.4% |
| British | 94.2 /100 | #125 | Exceptional 40.4% |