Albanian vs Tlingit-Haida Nursery School
COMPARE
Albanian
Tlingit-Haida
Nursery School
Nursery School Comparison
Albanians
Tlingit-Haida
98.0%
NURSERY SCHOOL
48.9/ 100
METRIC RATING
177th/ 347
METRIC RANK
98.7%
NURSERY SCHOOL
100.0/ 100
METRIC RATING
11th/ 347
METRIC RANK
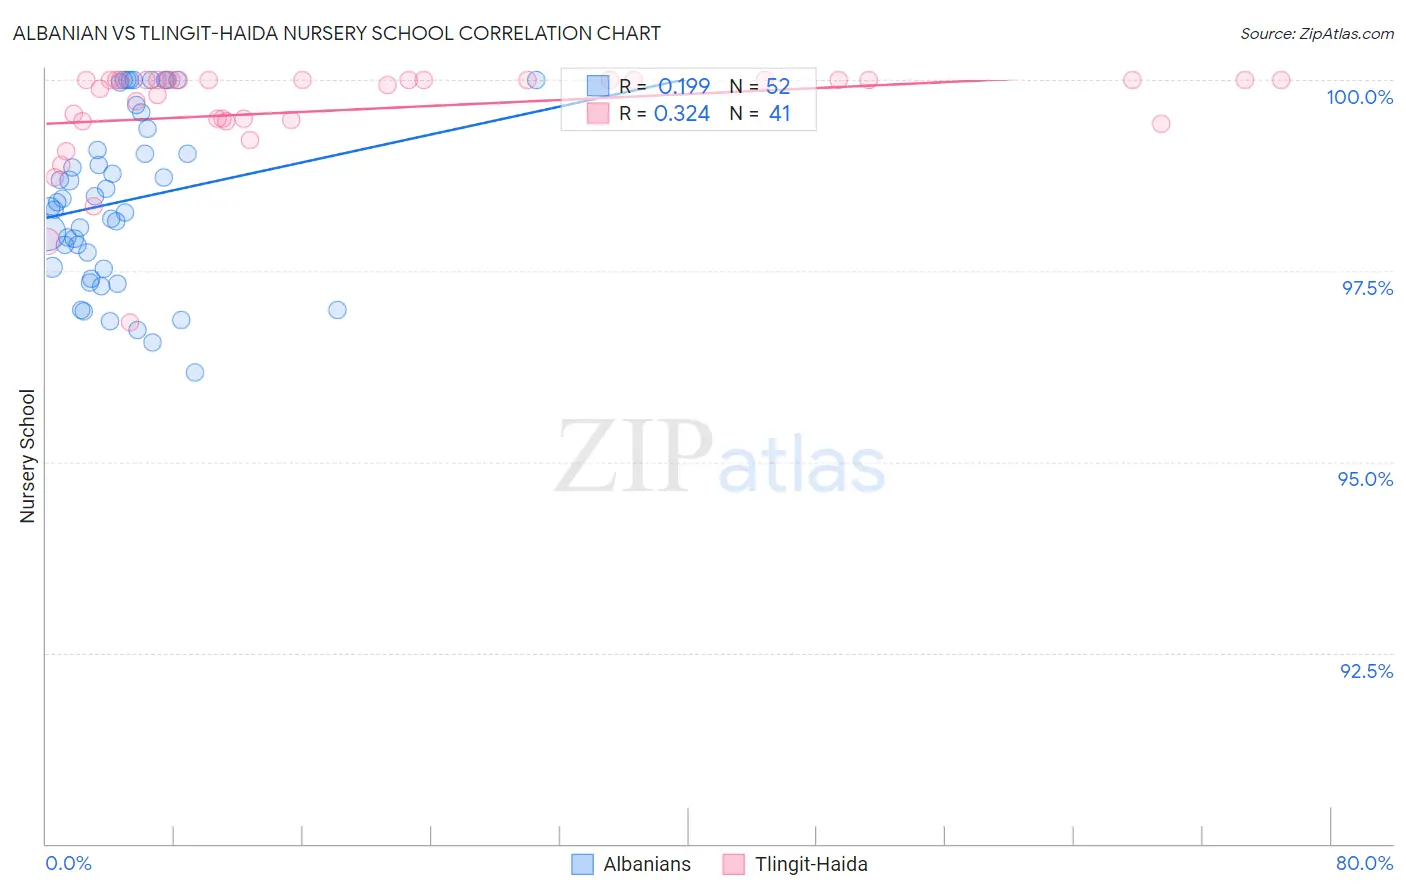
Albanian vs Tlingit-Haida Nursery School Correlation Chart
The statistical analysis conducted on geographies consisting of 193,265,850 people shows a poor positive correlation between the proportion of Albanians and percentage of population with at least nursery school education in the United States with a correlation coefficient (R) of 0.199 and weighted average of 98.0%. Similarly, the statistical analysis conducted on geographies consisting of 60,865,648 people shows a mild positive correlation between the proportion of Tlingit-Haida and percentage of population with at least nursery school education in the United States with a correlation coefficient (R) of 0.324 and weighted average of 98.7%, a difference of 0.76%.
Nursery School Correlation Summary
| Measurement | Albanian | Tlingit-Haida |
| Minimum | 96.2% | 96.8% |
| Maximum | 100.0% | 100.0% |
| Range | 3.8% | 3.2% |
| Mean | 98.4% | 99.6% |
| Median | 98.4% | 100.0% |
| Interquartile 25% (IQ1) | 97.5% | 99.5% |
| Interquartile 75% (IQ3) | 99.2% | 100.0% |
| Interquartile Range (IQR) | 1.7% | 0.53% |
| Standard Deviation (Sample) | 1.1% | 0.67% |
| Standard Deviation (Population) | 1.1% | 0.66% |
Similar Demographics by Nursery School
Demographics Similar to Albanians by Nursery School
In terms of nursery school, the demographic groups most similar to Albanians are Kenyan (98.0%, a difference of 0.0%), Navajo (98.0%, a difference of 0.0%), Immigrants from Sri Lanka (98.0%, a difference of 0.0%), Immigrants from Venezuela (98.0%, a difference of 0.0%), and Native/Alaskan (98.0%, a difference of 0.0%).
| Demographics | Rating | Rank | Nursery School |
| Bermudans | 53.7 /100 | #170 | Average 98.0% |
| Immigrants | Jordan | 53.4 /100 | #171 | Average 98.0% |
| Immigrants | Brazil | 51.3 /100 | #172 | Average 98.0% |
| Kenyans | 50.2 /100 | #173 | Average 98.0% |
| Navajo | 50.0 /100 | #174 | Average 98.0% |
| Immigrants | Sri Lanka | 49.9 /100 | #175 | Average 98.0% |
| Immigrants | Venezuela | 49.8 /100 | #176 | Average 98.0% |
| Albanians | 48.9 /100 | #177 | Average 98.0% |
| Natives/Alaskans | 48.6 /100 | #178 | Average 98.0% |
| Argentineans | 46.8 /100 | #179 | Average 98.0% |
| Immigrants | Bosnia and Herzegovina | 45.6 /100 | #180 | Average 98.0% |
| Egyptians | 42.8 /100 | #181 | Average 98.0% |
| Paiute | 42.0 /100 | #182 | Average 98.0% |
| Portuguese | 41.8 /100 | #183 | Average 98.0% |
| Immigrants | Poland | 41.3 /100 | #184 | Average 98.0% |
Demographics Similar to Tlingit-Haida by Nursery School
In terms of nursery school, the demographic groups most similar to Tlingit-Haida are German (98.7%, a difference of 0.0%), Slovak (98.7%, a difference of 0.010%), Norwegian (98.7%, a difference of 0.020%), Slovene (98.7%, a difference of 0.020%), and English (98.7%, a difference of 0.030%).
| Demographics | Rating | Rank | Nursery School |
| Inupiat | 100.0 /100 | #4 | Exceptional 98.9% |
| Tsimshian | 100.0 /100 | #5 | Exceptional 98.9% |
| Alaskan Athabascans | 100.0 /100 | #6 | Exceptional 98.8% |
| Alaska Natives | 100.0 /100 | #7 | Exceptional 98.8% |
| Norwegians | 100.0 /100 | #8 | Exceptional 98.7% |
| Slovaks | 100.0 /100 | #9 | Exceptional 98.7% |
| Germans | 100.0 /100 | #10 | Exceptional 98.7% |
| Tlingit-Haida | 100.0 /100 | #11 | Exceptional 98.7% |
| Slovenes | 100.0 /100 | #12 | Exceptional 98.7% |
| English | 100.0 /100 | #13 | Exceptional 98.7% |
| Carpatho Rusyns | 100.0 /100 | #14 | Exceptional 98.7% |
| Swedes | 100.0 /100 | #15 | Exceptional 98.7% |
| Scottish | 100.0 /100 | #16 | Exceptional 98.7% |
| Aleuts | 100.0 /100 | #17 | Exceptional 98.7% |
| Dutch | 100.0 /100 | #18 | Exceptional 98.7% |