Albanian vs Immigrants from Kenya Bachelor's Degree
COMPARE
Albanian
Immigrants from Kenya
Bachelor's Degree
Bachelor's Degree Comparison
Albanians
Immigrants from Kenya
40.9%
BACHELOR'S DEGREE
96.5/ 100
METRIC RATING
110th/ 347
METRIC RANK
38.8%
BACHELOR'S DEGREE
73.8/ 100
METRIC RATING
155th/ 347
METRIC RANK
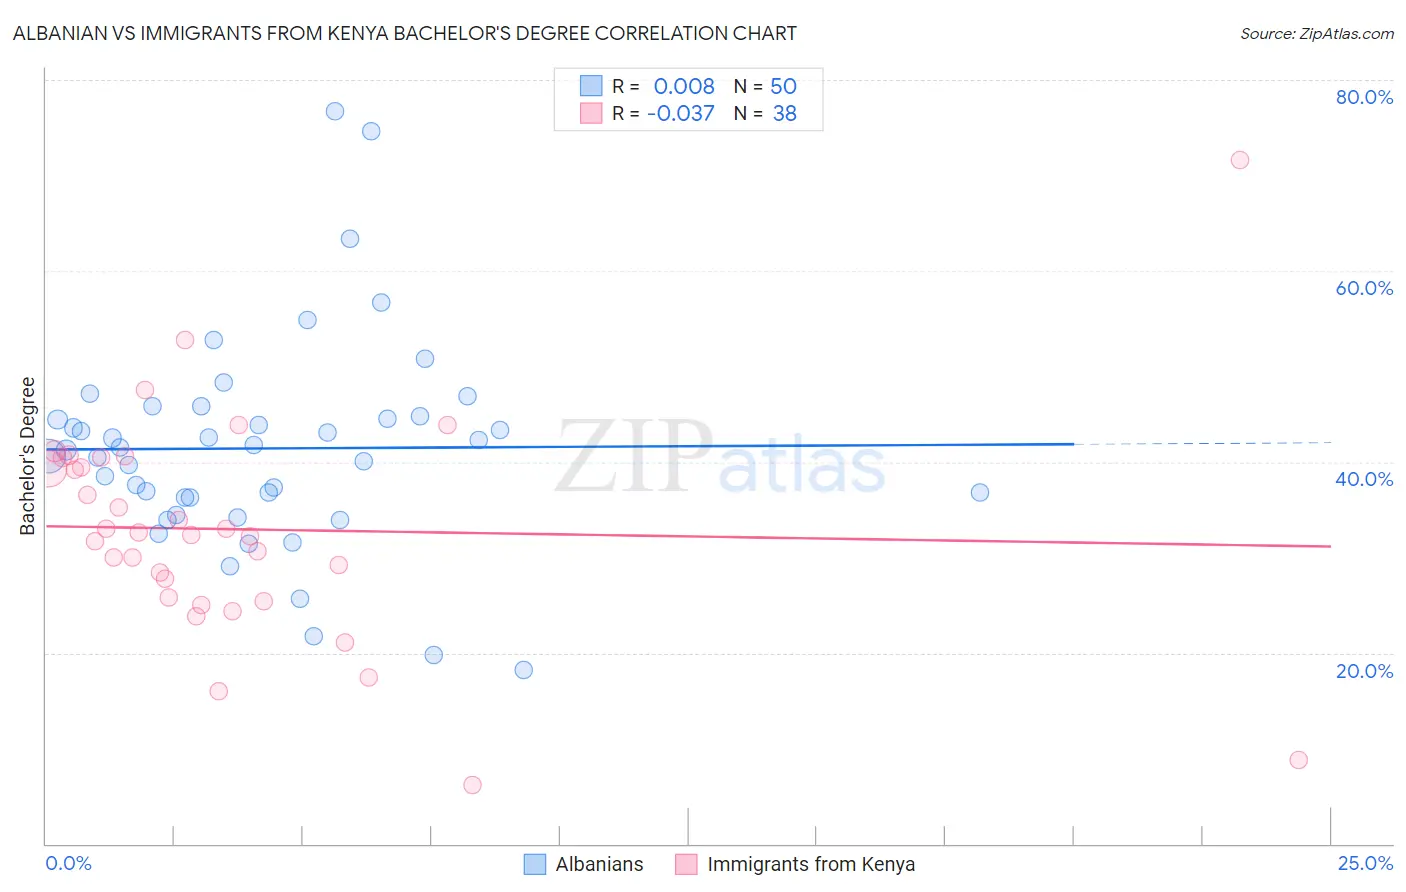
Albanian vs Immigrants from Kenya Bachelor's Degree Correlation Chart
The statistical analysis conducted on geographies consisting of 193,245,507 people shows no correlation between the proportion of Albanians and percentage of population with at least bachelor's degree education in the United States with a correlation coefficient (R) of 0.008 and weighted average of 40.9%. Similarly, the statistical analysis conducted on geographies consisting of 218,073,270 people shows no correlation between the proportion of Immigrants from Kenya and percentage of population with at least bachelor's degree education in the United States with a correlation coefficient (R) of -0.037 and weighted average of 38.8%, a difference of 5.4%.
Bachelor's Degree Correlation Summary
| Measurement | Albanian | Immigrants from Kenya |
| Minimum | 18.2% | 6.2% |
| Maximum | 76.7% | 71.6% |
| Range | 58.4% | 65.4% |
| Mean | 41.4% | 32.9% |
| Median | 41.4% | 32.5% |
| Interquartile 25% (IQ1) | 36.3% | 25.8% |
| Interquartile 75% (IQ3) | 44.8% | 40.5% |
| Interquartile Range (IQR) | 8.5% | 14.7% |
| Standard Deviation (Sample) | 11.2% | 11.8% |
| Standard Deviation (Population) | 11.1% | 11.7% |
Similar Demographics by Bachelor's Degree
Demographics Similar to Albanians by Bachelor's Degree
In terms of bachelor's degree, the demographic groups most similar to Albanians are Immigrants from Chile (40.8%, a difference of 0.050%), Arab (40.9%, a difference of 0.080%), Ukrainian (40.9%, a difference of 0.090%), Ugandan (40.8%, a difference of 0.090%), and Brazilian (40.8%, a difference of 0.14%).
| Demographics | Rating | Rank | Bachelor's Degree |
| Chileans | 97.5 /100 | #103 | Exceptional 41.2% |
| Jordanians | 97.4 /100 | #104 | Exceptional 41.2% |
| Syrians | 97.4 /100 | #105 | Exceptional 41.1% |
| Alsatians | 97.0 /100 | #106 | Exceptional 41.0% |
| Northern Europeans | 96.8 /100 | #107 | Exceptional 41.0% |
| Ukrainians | 96.6 /100 | #108 | Exceptional 40.9% |
| Arabs | 96.6 /100 | #109 | Exceptional 40.9% |
| Albanians | 96.5 /100 | #110 | Exceptional 40.9% |
| Immigrants | Chile | 96.4 /100 | #111 | Exceptional 40.8% |
| Ugandans | 96.3 /100 | #112 | Exceptional 40.8% |
| Brazilians | 96.3 /100 | #113 | Exceptional 40.8% |
| Afghans | 96.2 /100 | #114 | Exceptional 40.8% |
| Palestinians | 95.8 /100 | #115 | Exceptional 40.7% |
| Immigrants | Uganda | 95.7 /100 | #116 | Exceptional 40.7% |
| Austrians | 95.5 /100 | #117 | Exceptional 40.6% |
Demographics Similar to Immigrants from Kenya by Bachelor's Degree
In terms of bachelor's degree, the demographic groups most similar to Immigrants from Kenya are Canadian (38.8%, a difference of 0.15%), Kenyan (38.7%, a difference of 0.15%), Slavic (38.9%, a difference of 0.27%), Sudanese (38.9%, a difference of 0.33%), and Immigrants from Africa (38.9%, a difference of 0.35%).
| Demographics | Rating | Rank | Bachelor's Degree |
| Iraqis | 78.1 /100 | #148 | Good 39.0% |
| Immigrants | Poland | 77.5 /100 | #149 | Good 39.0% |
| South Americans | 77.3 /100 | #150 | Good 38.9% |
| Immigrants | Africa | 76.5 /100 | #151 | Good 38.9% |
| Sudanese | 76.4 /100 | #152 | Good 38.9% |
| Slavs | 75.9 /100 | #153 | Good 38.9% |
| Canadians | 75.0 /100 | #154 | Good 38.8% |
| Immigrants | Kenya | 73.8 /100 | #155 | Good 38.8% |
| Kenyans | 72.5 /100 | #156 | Good 38.7% |
| Immigrants | South America | 70.1 /100 | #157 | Good 38.6% |
| Immigrants | Germany | 69.6 /100 | #158 | Good 38.6% |
| Chinese | 66.6 /100 | #159 | Good 38.5% |
| Vietnamese | 66.6 /100 | #160 | Good 38.5% |
| Uruguayans | 65.8 /100 | #161 | Good 38.4% |
| Colombians | 65.0 /100 | #162 | Good 38.4% |