Slavic vs Tlingit-Haida Bachelor's Degree
COMPARE
Slavic
Tlingit-Haida
Bachelor's Degree
Bachelor's Degree Comparison
Slavs
Tlingit-Haida
38.9%
BACHELOR'S DEGREE
75.9/ 100
METRIC RATING
153rd/ 347
METRIC RANK
34.6%
BACHELOR'S DEGREE
2.8/ 100
METRIC RATING
237th/ 347
METRIC RANK
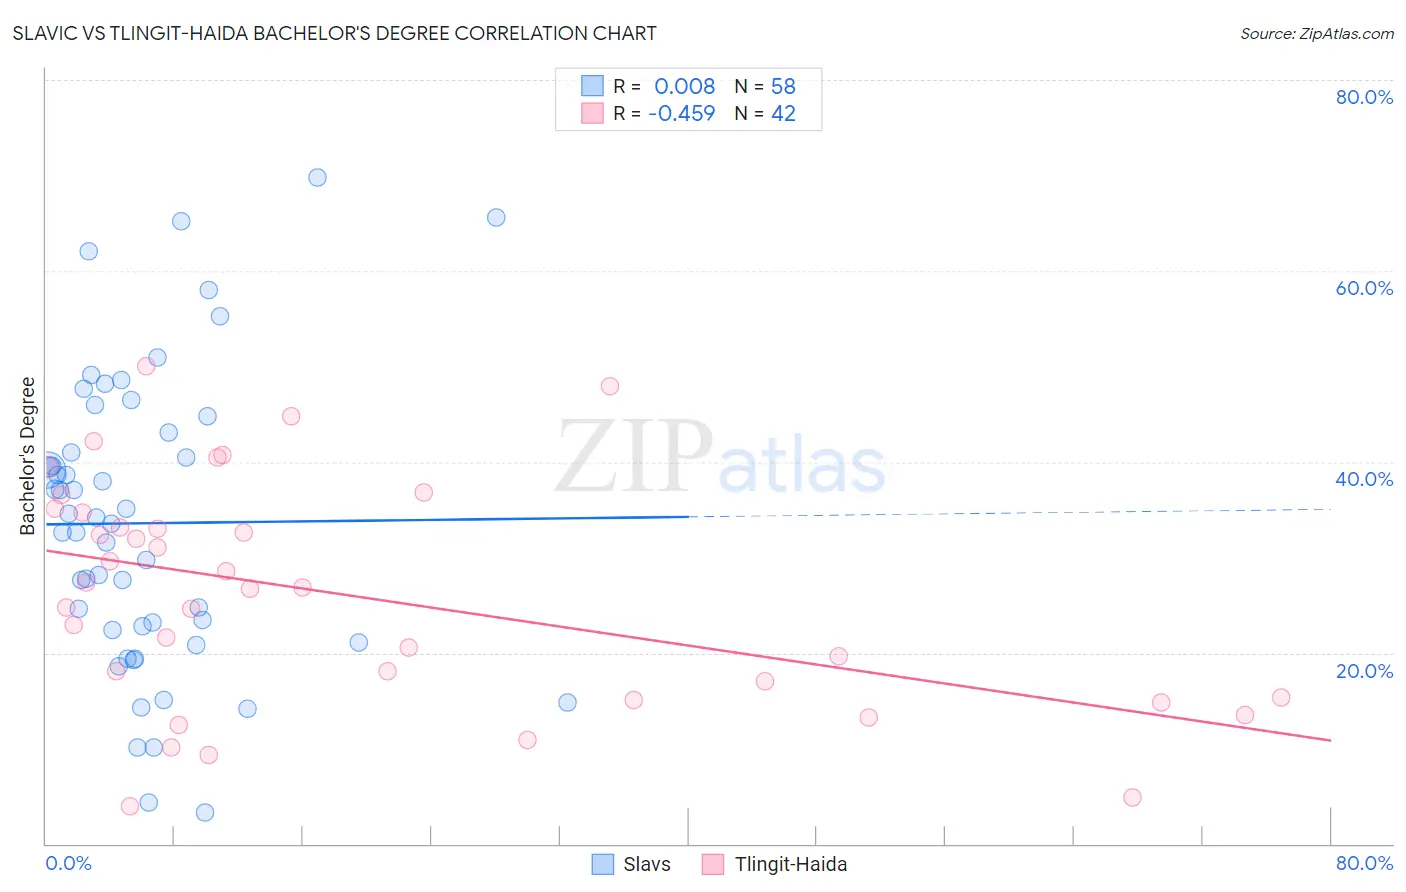
Slavic vs Tlingit-Haida Bachelor's Degree Correlation Chart
The statistical analysis conducted on geographies consisting of 270,854,926 people shows no correlation between the proportion of Slavs and percentage of population with at least bachelor's degree education in the United States with a correlation coefficient (R) of 0.008 and weighted average of 38.9%. Similarly, the statistical analysis conducted on geographies consisting of 60,872,339 people shows a moderate negative correlation between the proportion of Tlingit-Haida and percentage of population with at least bachelor's degree education in the United States with a correlation coefficient (R) of -0.459 and weighted average of 34.6%, a difference of 12.5%.
Bachelor's Degree Correlation Summary
| Measurement | Slavic | Tlingit-Haida |
| Minimum | 3.3% | 4.0% |
| Maximum | 69.8% | 50.0% |
| Range | 66.4% | 46.0% |
| Mean | 33.6% | 26.0% |
| Median | 33.9% | 26.8% |
| Interquartile 25% (IQ1) | 22.4% | 15.4% |
| Interquartile 75% (IQ3) | 43.0% | 34.8% |
| Interquartile Range (IQR) | 20.7% | 19.4% |
| Standard Deviation (Sample) | 15.4% | 11.9% |
| Standard Deviation (Population) | 15.3% | 11.7% |
Similar Demographics by Bachelor's Degree
Demographics Similar to Slavs by Bachelor's Degree
In terms of bachelor's degree, the demographic groups most similar to Slavs are Sudanese (38.9%, a difference of 0.060%), Immigrants from Africa (38.9%, a difference of 0.080%), Canadian (38.8%, a difference of 0.12%), South American (38.9%, a difference of 0.18%), and Immigrants from Poland (39.0%, a difference of 0.20%).
| Demographics | Rating | Rank | Bachelor's Degree |
| Swedes | 79.2 /100 | #146 | Good 39.1% |
| Immigrants | Sierra Leone | 79.0 /100 | #147 | Good 39.0% |
| Iraqis | 78.1 /100 | #148 | Good 39.0% |
| Immigrants | Poland | 77.5 /100 | #149 | Good 39.0% |
| South Americans | 77.3 /100 | #150 | Good 38.9% |
| Immigrants | Africa | 76.5 /100 | #151 | Good 38.9% |
| Sudanese | 76.4 /100 | #152 | Good 38.9% |
| Slavs | 75.9 /100 | #153 | Good 38.9% |
| Canadians | 75.0 /100 | #154 | Good 38.8% |
| Immigrants | Kenya | 73.8 /100 | #155 | Good 38.8% |
| Kenyans | 72.5 /100 | #156 | Good 38.7% |
| Immigrants | South America | 70.1 /100 | #157 | Good 38.6% |
| Immigrants | Germany | 69.6 /100 | #158 | Good 38.6% |
| Chinese | 66.6 /100 | #159 | Good 38.5% |
| Vietnamese | 66.6 /100 | #160 | Good 38.5% |
Demographics Similar to Tlingit-Haida by Bachelor's Degree
In terms of bachelor's degree, the demographic groups most similar to Tlingit-Haida are Liberian (34.6%, a difference of 0.040%), Immigrants from West Indies (34.6%, a difference of 0.14%), Guamanian/Chamorro (34.6%, a difference of 0.24%), Guyanese (34.5%, a difference of 0.28%), and British West Indian (34.5%, a difference of 0.30%).
| Demographics | Rating | Rank | Bachelor's Degree |
| Immigrants | Grenada | 4.3 /100 | #230 | Tragic 35.0% |
| Immigrants | St. Vincent and the Grenadines | 4.3 /100 | #231 | Tragic 35.0% |
| Hmong | 3.4 /100 | #232 | Tragic 34.8% |
| Immigrants | Ecuador | 3.3 /100 | #233 | Tragic 34.7% |
| Guamanians/Chamorros | 3.0 /100 | #234 | Tragic 34.6% |
| Immigrants | West Indies | 2.9 /100 | #235 | Tragic 34.6% |
| Liberians | 2.8 /100 | #236 | Tragic 34.6% |
| Tlingit-Haida | 2.8 /100 | #237 | Tragic 34.6% |
| Guyanese | 2.5 /100 | #238 | Tragic 34.5% |
| British West Indians | 2.5 /100 | #239 | Tragic 34.5% |
| Tongans | 2.0 /100 | #240 | Tragic 34.3% |
| Immigrants | Cambodia | 1.9 /100 | #241 | Tragic 34.2% |
| Immigrants | Nonimmigrants | 1.8 /100 | #242 | Tragic 34.2% |
| Immigrants | Guyana | 1.4 /100 | #243 | Tragic 33.9% |
| Delaware | 1.2 /100 | #244 | Tragic 33.8% |