Immigrants from Caribbean vs Tlingit-Haida Bachelor's Degree
COMPARE
Immigrants from Caribbean
Tlingit-Haida
Bachelor's Degree
Bachelor's Degree Comparison
Immigrants from Caribbean
Tlingit-Haida
31.4%
BACHELOR'S DEGREE
0.1/ 100
METRIC RATING
282nd/ 347
METRIC RANK
34.6%
BACHELOR'S DEGREE
2.8/ 100
METRIC RATING
237th/ 347
METRIC RANK
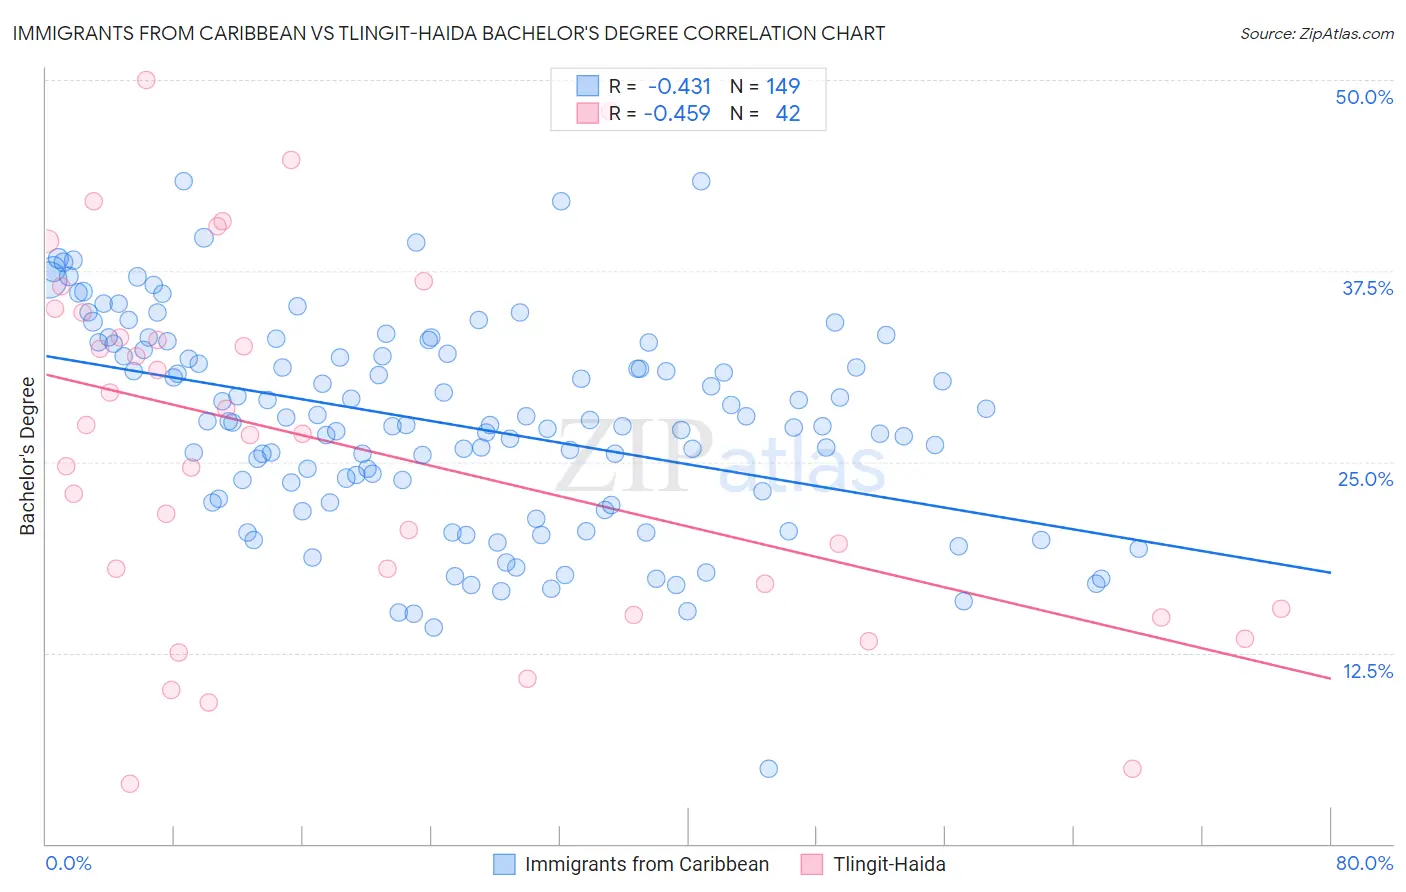
Immigrants from Caribbean vs Tlingit-Haida Bachelor's Degree Correlation Chart
The statistical analysis conducted on geographies consisting of 450,021,690 people shows a moderate negative correlation between the proportion of Immigrants from Caribbean and percentage of population with at least bachelor's degree education in the United States with a correlation coefficient (R) of -0.431 and weighted average of 31.4%. Similarly, the statistical analysis conducted on geographies consisting of 60,872,339 people shows a moderate negative correlation between the proportion of Tlingit-Haida and percentage of population with at least bachelor's degree education in the United States with a correlation coefficient (R) of -0.459 and weighted average of 34.6%, a difference of 10.0%.
Bachelor's Degree Correlation Summary
| Measurement | Immigrants from Caribbean | Tlingit-Haida |
| Minimum | 4.9% | 4.0% |
| Maximum | 43.4% | 50.0% |
| Range | 38.5% | 46.0% |
| Mean | 27.5% | 26.0% |
| Median | 27.6% | 26.8% |
| Interquartile 25% (IQ1) | 22.5% | 15.4% |
| Interquartile 75% (IQ3) | 32.6% | 34.8% |
| Interquartile Range (IQR) | 10.1% | 19.4% |
| Standard Deviation (Sample) | 6.8% | 11.9% |
| Standard Deviation (Population) | 6.8% | 11.7% |
Similar Demographics by Bachelor's Degree
Demographics Similar to Immigrants from Caribbean by Bachelor's Degree
In terms of bachelor's degree, the demographic groups most similar to Immigrants from Caribbean are Blackfeet (31.5%, a difference of 0.15%), Honduran (31.3%, a difference of 0.28%), Haitian (31.3%, a difference of 0.31%), Aleut (31.3%, a difference of 0.32%), and Immigrants from El Salvador (31.3%, a difference of 0.38%).
| Demographics | Rating | Rank | Bachelor's Degree |
| Samoans | 0.1 /100 | #275 | Tragic 31.8% |
| Salvadorans | 0.1 /100 | #276 | Tragic 31.8% |
| Dominicans | 0.1 /100 | #277 | Tragic 31.8% |
| Marshallese | 0.1 /100 | #278 | Tragic 31.7% |
| Hawaiians | 0.1 /100 | #279 | Tragic 31.6% |
| Immigrants | Laos | 0.1 /100 | #280 | Tragic 31.6% |
| Blackfeet | 0.1 /100 | #281 | Tragic 31.5% |
| Immigrants | Caribbean | 0.1 /100 | #282 | Tragic 31.4% |
| Hondurans | 0.1 /100 | #283 | Tragic 31.3% |
| Haitians | 0.1 /100 | #284 | Tragic 31.3% |
| Aleuts | 0.1 /100 | #285 | Tragic 31.3% |
| Immigrants | El Salvador | 0.1 /100 | #286 | Tragic 31.3% |
| Ottawa | 0.1 /100 | #287 | Tragic 31.1% |
| Guatemalans | 0.1 /100 | #288 | Tragic 31.0% |
| Puerto Ricans | 0.1 /100 | #289 | Tragic 31.0% |
Demographics Similar to Tlingit-Haida by Bachelor's Degree
In terms of bachelor's degree, the demographic groups most similar to Tlingit-Haida are Liberian (34.6%, a difference of 0.040%), Immigrants from West Indies (34.6%, a difference of 0.14%), Guamanian/Chamorro (34.6%, a difference of 0.24%), Guyanese (34.5%, a difference of 0.28%), and British West Indian (34.5%, a difference of 0.30%).
| Demographics | Rating | Rank | Bachelor's Degree |
| Immigrants | Grenada | 4.3 /100 | #230 | Tragic 35.0% |
| Immigrants | St. Vincent and the Grenadines | 4.3 /100 | #231 | Tragic 35.0% |
| Hmong | 3.4 /100 | #232 | Tragic 34.8% |
| Immigrants | Ecuador | 3.3 /100 | #233 | Tragic 34.7% |
| Guamanians/Chamorros | 3.0 /100 | #234 | Tragic 34.6% |
| Immigrants | West Indies | 2.9 /100 | #235 | Tragic 34.6% |
| Liberians | 2.8 /100 | #236 | Tragic 34.6% |
| Tlingit-Haida | 2.8 /100 | #237 | Tragic 34.6% |
| Guyanese | 2.5 /100 | #238 | Tragic 34.5% |
| British West Indians | 2.5 /100 | #239 | Tragic 34.5% |
| Tongans | 2.0 /100 | #240 | Tragic 34.3% |
| Immigrants | Cambodia | 1.9 /100 | #241 | Tragic 34.2% |
| Immigrants | Nonimmigrants | 1.8 /100 | #242 | Tragic 34.2% |
| Immigrants | Guyana | 1.4 /100 | #243 | Tragic 33.9% |
| Delaware | 1.2 /100 | #244 | Tragic 33.8% |