Spanish American vs Tlingit-Haida Bachelor's Degree
COMPARE
Spanish American
Tlingit-Haida
Bachelor's Degree
Bachelor's Degree Comparison
Spanish Americans
Tlingit-Haida
33.1%
BACHELOR'S DEGREE
0.6/ 100
METRIC RATING
257th/ 347
METRIC RANK
34.6%
BACHELOR'S DEGREE
2.8/ 100
METRIC RATING
237th/ 347
METRIC RANK
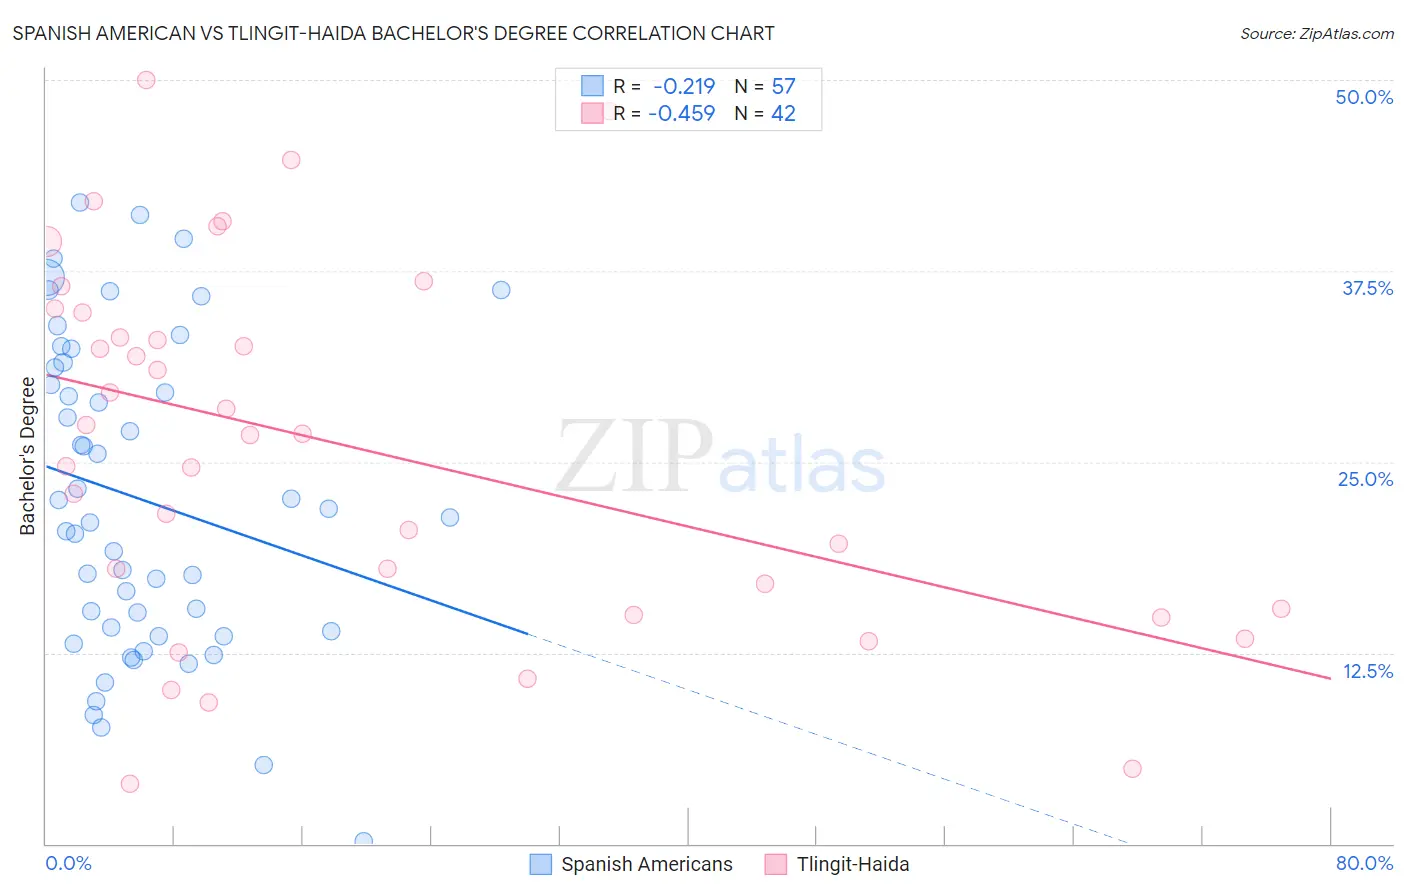
Spanish American vs Tlingit-Haida Bachelor's Degree Correlation Chart
The statistical analysis conducted on geographies consisting of 103,166,639 people shows a weak negative correlation between the proportion of Spanish Americans and percentage of population with at least bachelor's degree education in the United States with a correlation coefficient (R) of -0.219 and weighted average of 33.1%. Similarly, the statistical analysis conducted on geographies consisting of 60,872,339 people shows a moderate negative correlation between the proportion of Tlingit-Haida and percentage of population with at least bachelor's degree education in the United States with a correlation coefficient (R) of -0.459 and weighted average of 34.6%, a difference of 4.5%.
Bachelor's Degree Correlation Summary
| Measurement | Spanish American | Tlingit-Haida |
| Minimum | 0.16% | 4.0% |
| Maximum | 41.9% | 50.0% |
| Range | 41.8% | 46.0% |
| Mean | 22.5% | 26.0% |
| Median | 21.3% | 26.8% |
| Interquartile 25% (IQ1) | 13.8% | 15.4% |
| Interquartile 75% (IQ3) | 31.3% | 34.8% |
| Interquartile Range (IQR) | 17.5% | 19.4% |
| Standard Deviation (Sample) | 10.2% | 11.9% |
| Standard Deviation (Population) | 10.2% | 11.7% |
Demographics Similar to Spanish Americans and Tlingit-Haida by Bachelor's Degree
In terms of bachelor's degree, the demographic groups most similar to Spanish Americans are Nicaraguan (33.1%, a difference of 0.22%), Iroquois (33.2%, a difference of 0.41%), Native Hawaiian (33.2%, a difference of 0.43%), U.S. Virgin Islander (33.2%, a difference of 0.49%), and Immigrants from Bahamas (33.3%, a difference of 0.70%). Similarly, the demographic groups most similar to Tlingit-Haida are Guyanese (34.5%, a difference of 0.28%), British West Indian (34.5%, a difference of 0.30%), Tongan (34.3%, a difference of 0.84%), Immigrants from Cambodia (34.2%, a difference of 1.1%), and Nonimmigrants (34.2%, a difference of 1.2%).
| Demographics | Rating | Rank | Bachelor's Degree |
| Tlingit-Haida | 2.8 /100 | #237 | Tragic 34.6% |
| Guyanese | 2.5 /100 | #238 | Tragic 34.5% |
| British West Indians | 2.5 /100 | #239 | Tragic 34.5% |
| Tongans | 2.0 /100 | #240 | Tragic 34.3% |
| Immigrants | Cambodia | 1.9 /100 | #241 | Tragic 34.2% |
| Immigrants | Nonimmigrants | 1.8 /100 | #242 | Tragic 34.2% |
| Immigrants | Guyana | 1.4 /100 | #243 | Tragic 33.9% |
| Delaware | 1.2 /100 | #244 | Tragic 33.8% |
| Immigrants | Fiji | 1.2 /100 | #245 | Tragic 33.7% |
| Jamaicans | 1.0 /100 | #246 | Tragic 33.6% |
| Immigrants | Congo | 1.0 /100 | #247 | Tragic 33.6% |
| Cree | 1.0 /100 | #248 | Tragic 33.6% |
| Immigrants | Liberia | 0.9 /100 | #249 | Tragic 33.5% |
| Indonesians | 0.9 /100 | #250 | Tragic 33.5% |
| Japanese | 0.7 /100 | #251 | Tragic 33.3% |
| Immigrants | Bahamas | 0.7 /100 | #252 | Tragic 33.3% |
| U.S. Virgin Islanders | 0.7 /100 | #253 | Tragic 33.2% |
| Native Hawaiians | 0.7 /100 | #254 | Tragic 33.2% |
| Iroquois | 0.7 /100 | #255 | Tragic 33.2% |
| Nicaraguans | 0.6 /100 | #256 | Tragic 33.1% |
| Spanish Americans | 0.6 /100 | #257 | Tragic 33.1% |