Barbadian vs Tlingit-Haida Bachelor's Degree
COMPARE
Barbadian
Tlingit-Haida
Bachelor's Degree
Bachelor's Degree Comparison
Barbadians
Tlingit-Haida
36.1%
BACHELOR'S DEGREE
13.5/ 100
METRIC RATING
216th/ 347
METRIC RANK
34.6%
BACHELOR'S DEGREE
2.8/ 100
METRIC RATING
237th/ 347
METRIC RANK
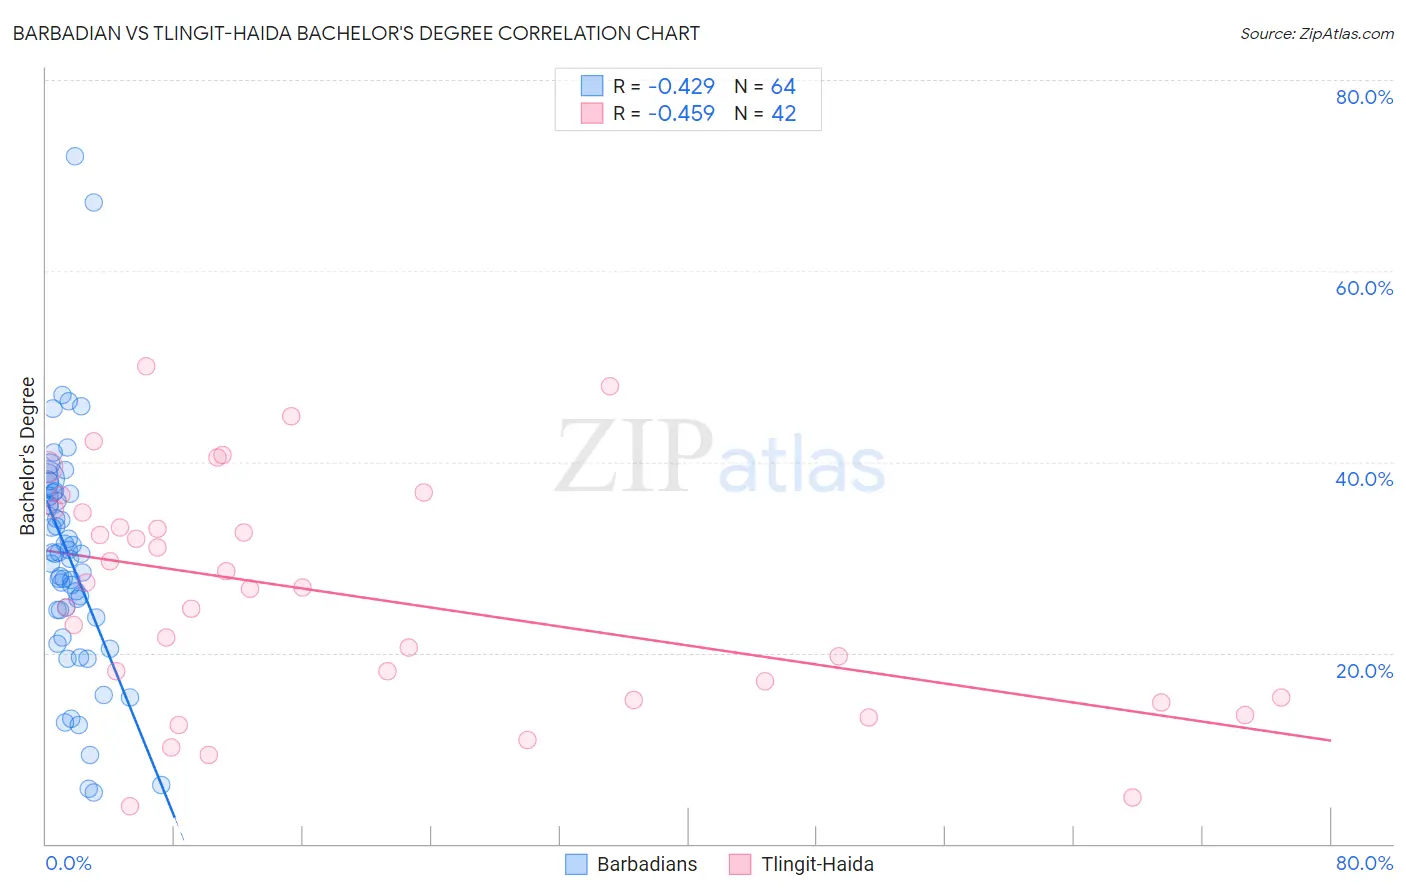
Barbadian vs Tlingit-Haida Bachelor's Degree Correlation Chart
The statistical analysis conducted on geographies consisting of 141,300,746 people shows a moderate negative correlation between the proportion of Barbadians and percentage of population with at least bachelor's degree education in the United States with a correlation coefficient (R) of -0.429 and weighted average of 36.1%. Similarly, the statistical analysis conducted on geographies consisting of 60,872,339 people shows a moderate negative correlation between the proportion of Tlingit-Haida and percentage of population with at least bachelor's degree education in the United States with a correlation coefficient (R) of -0.459 and weighted average of 34.6%, a difference of 4.5%.
Bachelor's Degree Correlation Summary
| Measurement | Barbadian | Tlingit-Haida |
| Minimum | 5.4% | 4.0% |
| Maximum | 72.0% | 50.0% |
| Range | 66.6% | 46.0% |
| Mean | 30.0% | 26.0% |
| Median | 30.3% | 26.8% |
| Interquartile 25% (IQ1) | 24.1% | 15.4% |
| Interquartile 75% (IQ3) | 36.8% | 34.8% |
| Interquartile Range (IQR) | 12.7% | 19.4% |
| Standard Deviation (Sample) | 12.3% | 11.9% |
| Standard Deviation (Population) | 12.2% | 11.7% |
Similar Demographics by Bachelor's Degree
Demographics Similar to Barbadians by Bachelor's Degree
In terms of bachelor's degree, the demographic groups most similar to Barbadians are Immigrants from Western Africa (36.1%, a difference of 0.060%), German (36.1%, a difference of 0.090%), Immigrants from Panama (36.2%, a difference of 0.16%), German Russian (35.8%, a difference of 0.81%), and Immigrants from Philippines (36.4%, a difference of 0.84%).
| Demographics | Rating | Rank | Bachelor's Degree |
| Panamanians | 18.8 /100 | #209 | Poor 36.5% |
| French | 18.6 /100 | #210 | Poor 36.5% |
| Scotch-Irish | 18.3 /100 | #211 | Poor 36.4% |
| Immigrants | Philippines | 17.8 /100 | #212 | Poor 36.4% |
| Immigrants | Panama | 14.2 /100 | #213 | Poor 36.2% |
| Germans | 13.9 /100 | #214 | Poor 36.1% |
| Immigrants | Western Africa | 13.8 /100 | #215 | Poor 36.1% |
| Barbadians | 13.5 /100 | #216 | Poor 36.1% |
| German Russians | 10.2 /100 | #217 | Poor 35.8% |
| Sub-Saharan Africans | 9.8 /100 | #218 | Tragic 35.8% |
| West Indians | 9.7 /100 | #219 | Tragic 35.8% |
| Spanish | 9.6 /100 | #220 | Tragic 35.8% |
| Dutch | 9.2 /100 | #221 | Tragic 35.7% |
| Trinidadians and Tobagonians | 8.8 /100 | #222 | Tragic 35.7% |
| French Canadians | 8.3 /100 | #223 | Tragic 35.6% |
Demographics Similar to Tlingit-Haida by Bachelor's Degree
In terms of bachelor's degree, the demographic groups most similar to Tlingit-Haida are Liberian (34.6%, a difference of 0.040%), Immigrants from West Indies (34.6%, a difference of 0.14%), Guamanian/Chamorro (34.6%, a difference of 0.24%), Guyanese (34.5%, a difference of 0.28%), and British West Indian (34.5%, a difference of 0.30%).
| Demographics | Rating | Rank | Bachelor's Degree |
| Immigrants | Grenada | 4.3 /100 | #230 | Tragic 35.0% |
| Immigrants | St. Vincent and the Grenadines | 4.3 /100 | #231 | Tragic 35.0% |
| Hmong | 3.4 /100 | #232 | Tragic 34.8% |
| Immigrants | Ecuador | 3.3 /100 | #233 | Tragic 34.7% |
| Guamanians/Chamorros | 3.0 /100 | #234 | Tragic 34.6% |
| Immigrants | West Indies | 2.9 /100 | #235 | Tragic 34.6% |
| Liberians | 2.8 /100 | #236 | Tragic 34.6% |
| Tlingit-Haida | 2.8 /100 | #237 | Tragic 34.6% |
| Guyanese | 2.5 /100 | #238 | Tragic 34.5% |
| British West Indians | 2.5 /100 | #239 | Tragic 34.5% |
| Tongans | 2.0 /100 | #240 | Tragic 34.3% |
| Immigrants | Cambodia | 1.9 /100 | #241 | Tragic 34.2% |
| Immigrants | Nonimmigrants | 1.8 /100 | #242 | Tragic 34.2% |
| Immigrants | Guyana | 1.4 /100 | #243 | Tragic 33.9% |
| Delaware | 1.2 /100 | #244 | Tragic 33.8% |