Albanian vs Immigrants from Western Asia No Schooling Completed
COMPARE
Albanian
Immigrants from Western Asia
No Schooling Completed
No Schooling Completed Comparison
Albanians
Immigrants from Western Asia
2.1%
NO SCHOOLING COMPLETED
62.2/ 100
METRIC RATING
163rd/ 347
METRIC RANK
2.3%
NO SCHOOLING COMPLETED
2.6/ 100
METRIC RATING
235th/ 347
METRIC RANK
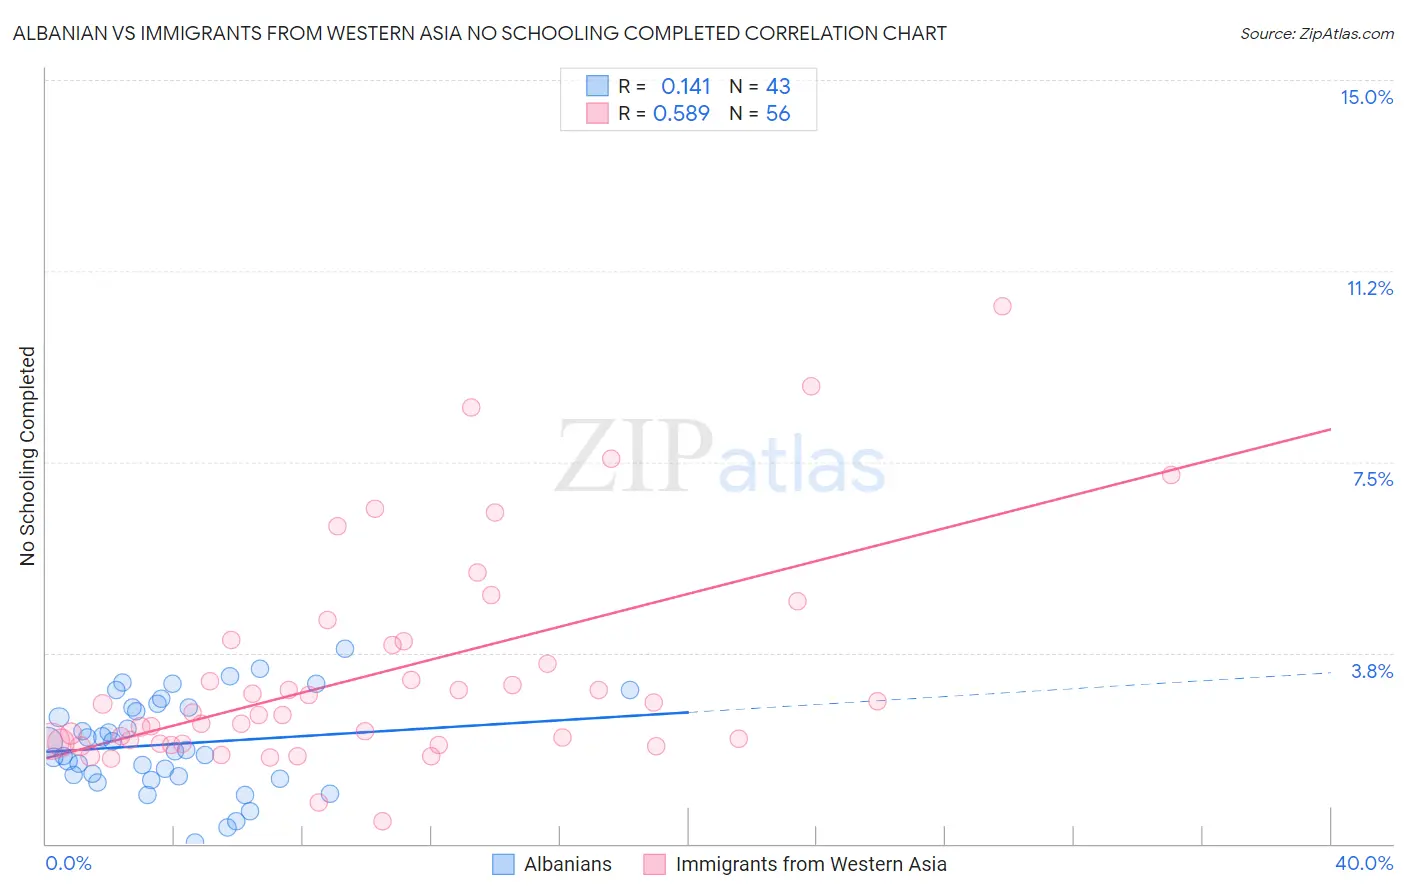
Albanian vs Immigrants from Western Asia No Schooling Completed Correlation Chart
The statistical analysis conducted on geographies consisting of 192,057,216 people shows a poor positive correlation between the proportion of Albanians and percentage of population with no schooling in the United States with a correlation coefficient (R) of 0.141 and weighted average of 2.1%. Similarly, the statistical analysis conducted on geographies consisting of 400,576,161 people shows a substantial positive correlation between the proportion of Immigrants from Western Asia and percentage of population with no schooling in the United States with a correlation coefficient (R) of 0.589 and weighted average of 2.3%, a difference of 14.1%.
No Schooling Completed Correlation Summary
| Measurement | Albanian | Immigrants from Western Asia |
| Minimum | 0.028% | 0.45% |
| Maximum | 3.8% | 10.6% |
| Range | 3.8% | 10.1% |
| Mean | 2.0% | 3.3% |
| Median | 1.9% | 2.5% |
| Interquartile 25% (IQ1) | 1.3% | 2.0% |
| Interquartile 75% (IQ3) | 2.7% | 3.9% |
| Interquartile Range (IQR) | 1.3% | 2.0% |
| Standard Deviation (Sample) | 0.90% | 2.1% |
| Standard Deviation (Population) | 0.89% | 2.1% |
Similar Demographics by No Schooling Completed
Demographics Similar to Albanians by No Schooling Completed
In terms of no schooling completed, the demographic groups most similar to Albanians are Comanche (2.1%, a difference of 0.22%), Immigrants from Brazil (2.1%, a difference of 0.24%), Brazilian (2.1%, a difference of 0.28%), Dutch West Indian (2.1%, a difference of 0.33%), and Ugandan (2.0%, a difference of 0.35%).
| Demographics | Rating | Rank | No Schooling Completed |
| Chileans | 67.2 /100 | #156 | Good 2.0% |
| Immigrants | Sri Lanka | 67.0 /100 | #157 | Good 2.0% |
| Immigrants | Korea | 66.7 /100 | #158 | Good 2.0% |
| Immigrants | Spain | 66.4 /100 | #159 | Good 2.0% |
| Kenyans | 65.7 /100 | #160 | Good 2.0% |
| Ugandans | 64.6 /100 | #161 | Good 2.0% |
| Immigrants | Brazil | 63.8 /100 | #162 | Good 2.1% |
| Albanians | 62.2 /100 | #163 | Good 2.1% |
| Comanche | 60.7 /100 | #164 | Good 2.1% |
| Brazilians | 60.2 /100 | #165 | Good 2.1% |
| Dutch West Indians | 59.9 /100 | #166 | Average 2.1% |
| Egyptians | 59.2 /100 | #167 | Average 2.1% |
| Cheyenne | 58.6 /100 | #168 | Average 2.1% |
| Apache | 56.7 /100 | #169 | Average 2.1% |
| Argentineans | 56.0 /100 | #170 | Average 2.1% |
Demographics Similar to Immigrants from Western Asia by No Schooling Completed
In terms of no schooling completed, the demographic groups most similar to Immigrants from Western Asia are Nigerian (2.3%, a difference of 0.020%), Immigrants from Malaysia (2.3%, a difference of 0.27%), Iraqi (2.4%, a difference of 0.54%), Colombian (2.3%, a difference of 0.62%), and Immigrants from Eastern Asia (2.4%, a difference of 0.74%).
| Demographics | Rating | Rank | No Schooling Completed |
| U.S. Virgin Islanders | 3.7 /100 | #228 | Tragic 2.3% |
| Immigrants | Pakistan | 3.6 /100 | #229 | Tragic 2.3% |
| Puerto Ricans | 3.4 /100 | #230 | Tragic 2.3% |
| Immigrants | Uruguay | 3.4 /100 | #231 | Tragic 2.3% |
| Colombians | 3.2 /100 | #232 | Tragic 2.3% |
| Immigrants | Malaysia | 2.8 /100 | #233 | Tragic 2.3% |
| Nigerians | 2.6 /100 | #234 | Tragic 2.3% |
| Immigrants | Western Asia | 2.6 /100 | #235 | Tragic 2.3% |
| Iraqis | 2.2 /100 | #236 | Tragic 2.4% |
| Immigrants | Eastern Asia | 2.0 /100 | #237 | Tragic 2.4% |
| Paiute | 1.9 /100 | #238 | Tragic 2.4% |
| Liberians | 1.8 /100 | #239 | Tragic 2.4% |
| Immigrants | Senegal | 1.7 /100 | #240 | Tragic 2.4% |
| Koreans | 1.7 /100 | #241 | Tragic 2.4% |
| Immigrants | Indonesia | 1.5 /100 | #242 | Tragic 2.4% |