Albanian vs Central American No Schooling Completed
COMPARE
Albanian
Central American
No Schooling Completed
No Schooling Completed Comparison
Albanians
Central Americans
2.1%
NO SCHOOLING COMPLETED
62.2/ 100
METRIC RATING
163rd/ 347
METRIC RANK
3.4%
NO SCHOOLING COMPLETED
0.0/ 100
METRIC RATING
332nd/ 347
METRIC RANK
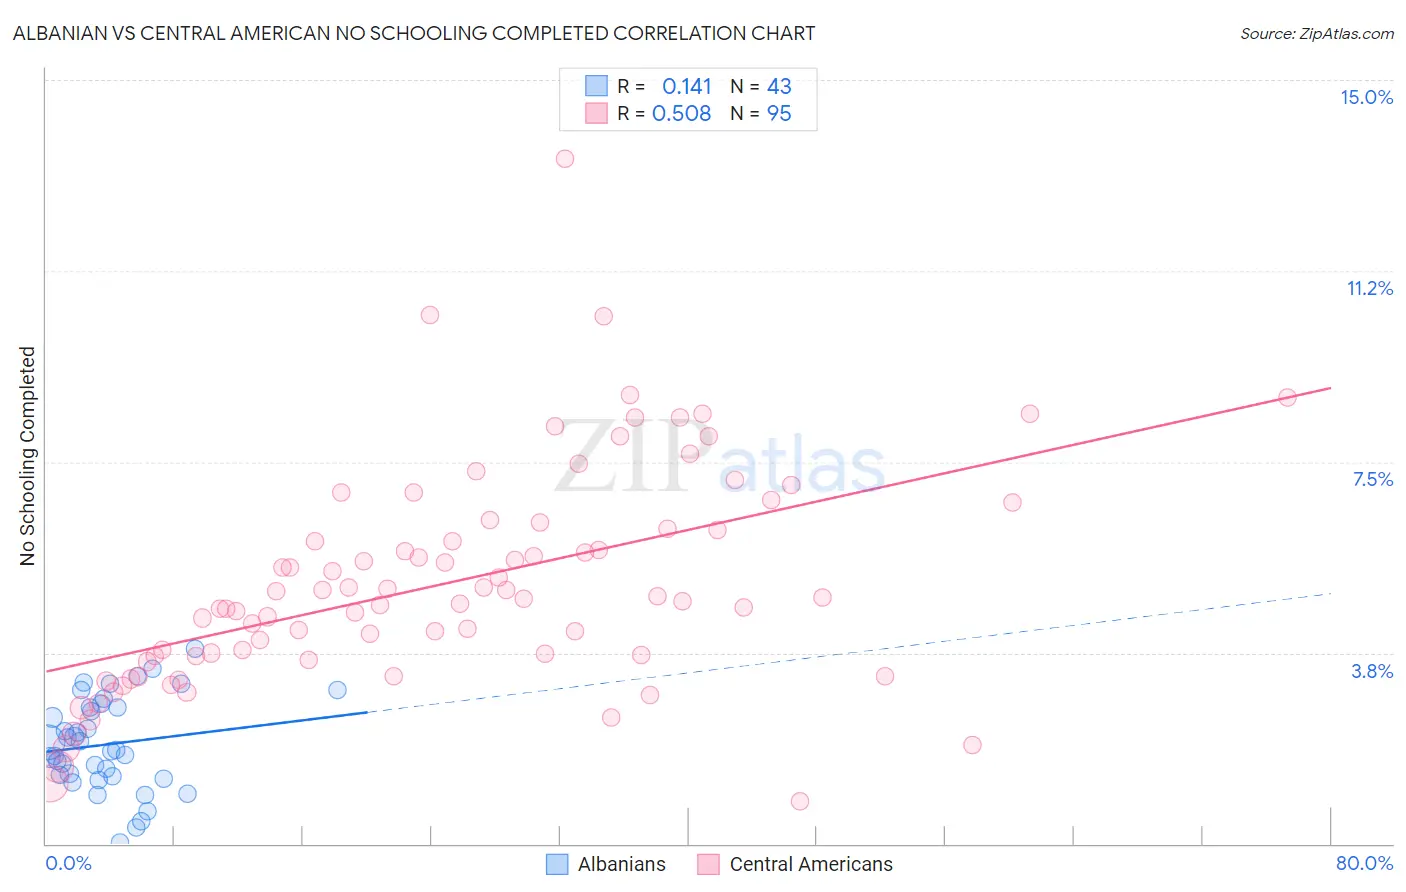
Albanian vs Central American No Schooling Completed Correlation Chart
The statistical analysis conducted on geographies consisting of 192,057,216 people shows a poor positive correlation between the proportion of Albanians and percentage of population with no schooling in the United States with a correlation coefficient (R) of 0.141 and weighted average of 2.1%. Similarly, the statistical analysis conducted on geographies consisting of 497,423,122 people shows a substantial positive correlation between the proportion of Central Americans and percentage of population with no schooling in the United States with a correlation coefficient (R) of 0.508 and weighted average of 3.4%, a difference of 65.2%.
No Schooling Completed Correlation Summary
| Measurement | Albanian | Central American |
| Minimum | 0.028% | 0.83% |
| Maximum | 3.8% | 13.5% |
| Range | 3.8% | 12.6% |
| Mean | 2.0% | 5.1% |
| Median | 1.9% | 4.8% |
| Interquartile 25% (IQ1) | 1.3% | 3.7% |
| Interquartile 75% (IQ3) | 2.7% | 6.2% |
| Interquartile Range (IQR) | 1.3% | 2.5% |
| Standard Deviation (Sample) | 0.90% | 2.2% |
| Standard Deviation (Population) | 0.89% | 2.1% |
Similar Demographics by No Schooling Completed
Demographics Similar to Albanians by No Schooling Completed
In terms of no schooling completed, the demographic groups most similar to Albanians are Comanche (2.1%, a difference of 0.22%), Immigrants from Brazil (2.1%, a difference of 0.24%), Brazilian (2.1%, a difference of 0.28%), Dutch West Indian (2.1%, a difference of 0.33%), and Ugandan (2.0%, a difference of 0.35%).
| Demographics | Rating | Rank | No Schooling Completed |
| Chileans | 67.2 /100 | #156 | Good 2.0% |
| Immigrants | Sri Lanka | 67.0 /100 | #157 | Good 2.0% |
| Immigrants | Korea | 66.7 /100 | #158 | Good 2.0% |
| Immigrants | Spain | 66.4 /100 | #159 | Good 2.0% |
| Kenyans | 65.7 /100 | #160 | Good 2.0% |
| Ugandans | 64.6 /100 | #161 | Good 2.0% |
| Immigrants | Brazil | 63.8 /100 | #162 | Good 2.1% |
| Albanians | 62.2 /100 | #163 | Good 2.1% |
| Comanche | 60.7 /100 | #164 | Good 2.1% |
| Brazilians | 60.2 /100 | #165 | Good 2.1% |
| Dutch West Indians | 59.9 /100 | #166 | Average 2.1% |
| Egyptians | 59.2 /100 | #167 | Average 2.1% |
| Cheyenne | 58.6 /100 | #168 | Average 2.1% |
| Apache | 56.7 /100 | #169 | Average 2.1% |
| Argentineans | 56.0 /100 | #170 | Average 2.1% |
Demographics Similar to Central Americans by No Schooling Completed
In terms of no schooling completed, the demographic groups most similar to Central Americans are Immigrants from Dominican Republic (3.4%, a difference of 0.060%), Japanese (3.3%, a difference of 1.5%), Immigrants from Armenia (3.3%, a difference of 1.5%), Guatemalan (3.5%, a difference of 1.8%), and Immigrants from Vietnam (3.3%, a difference of 2.0%).
| Demographics | Rating | Rank | No Schooling Completed |
| Dominicans | 0.0 /100 | #325 | Tragic 3.2% |
| Indonesians | 0.0 /100 | #326 | Tragic 3.2% |
| Immigrants | Latin America | 0.0 /100 | #327 | Tragic 3.3% |
| Mexicans | 0.0 /100 | #328 | Tragic 3.3% |
| Immigrants | Vietnam | 0.0 /100 | #329 | Tragic 3.3% |
| Immigrants | Armenia | 0.0 /100 | #330 | Tragic 3.3% |
| Japanese | 0.0 /100 | #331 | Tragic 3.3% |
| Central Americans | 0.0 /100 | #332 | Tragic 3.4% |
| Immigrants | Dominican Republic | 0.0 /100 | #333 | Tragic 3.4% |
| Guatemalans | 0.0 /100 | #334 | Tragic 3.5% |
| Immigrants | Cambodia | 0.0 /100 | #335 | Tragic 3.5% |
| Immigrants | Fiji | 0.0 /100 | #336 | Tragic 3.5% |
| Immigrants | Cabo Verde | 0.0 /100 | #337 | Tragic 3.5% |
| Bangladeshis | 0.0 /100 | #338 | Tragic 3.5% |
| Yakama | 0.0 /100 | #339 | Tragic 3.6% |