Albanian vs Immigrants from Saudi Arabia No Schooling Completed
COMPARE
Albanian
Immigrants from Saudi Arabia
No Schooling Completed
No Schooling Completed Comparison
Albanians
Immigrants from Saudi Arabia
2.1%
NO SCHOOLING COMPLETED
62.2/ 100
METRIC RATING
163rd/ 347
METRIC RANK
1.9%
NO SCHOOLING COMPLETED
96.8/ 100
METRIC RATING
109th/ 347
METRIC RANK
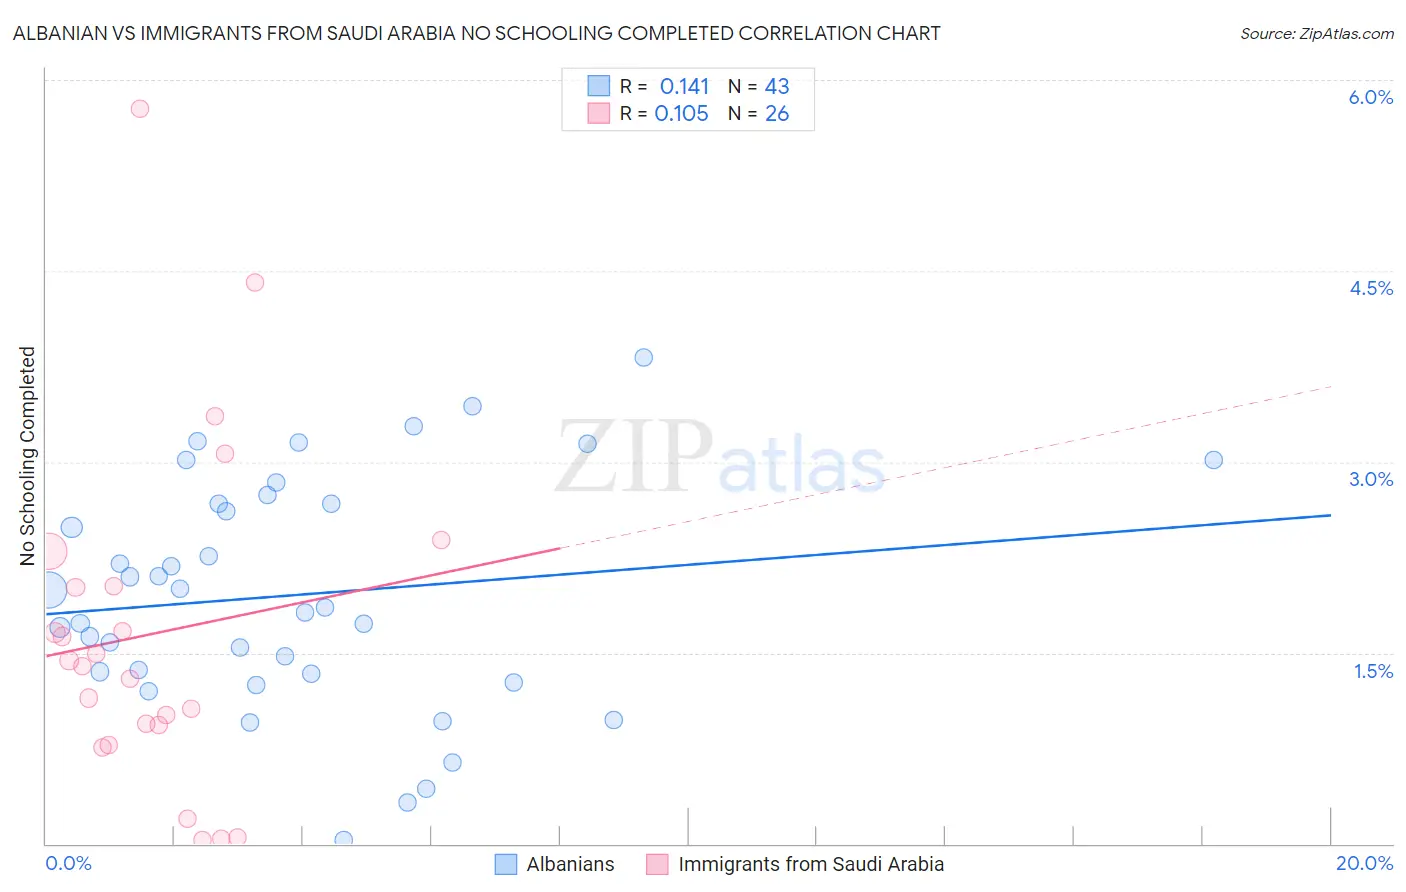
Albanian vs Immigrants from Saudi Arabia No Schooling Completed Correlation Chart
The statistical analysis conducted on geographies consisting of 192,057,216 people shows a poor positive correlation between the proportion of Albanians and percentage of population with no schooling in the United States with a correlation coefficient (R) of 0.141 and weighted average of 2.1%. Similarly, the statistical analysis conducted on geographies consisting of 163,882,762 people shows a poor positive correlation between the proportion of Immigrants from Saudi Arabia and percentage of population with no schooling in the United States with a correlation coefficient (R) of 0.105 and weighted average of 1.9%, a difference of 11.0%.
No Schooling Completed Correlation Summary
| Measurement | Albanian | Immigrants from Saudi Arabia |
| Minimum | 0.028% | 0.031% |
| Maximum | 3.8% | 5.8% |
| Range | 3.8% | 5.7% |
| Mean | 2.0% | 1.6% |
| Median | 1.9% | 1.4% |
| Interquartile 25% (IQ1) | 1.3% | 0.93% |
| Interquartile 75% (IQ3) | 2.7% | 2.0% |
| Interquartile Range (IQR) | 1.3% | 1.1% |
| Standard Deviation (Sample) | 0.90% | 1.3% |
| Standard Deviation (Population) | 0.89% | 1.3% |
Similar Demographics by No Schooling Completed
Demographics Similar to Albanians by No Schooling Completed
In terms of no schooling completed, the demographic groups most similar to Albanians are Comanche (2.1%, a difference of 0.22%), Immigrants from Brazil (2.1%, a difference of 0.24%), Brazilian (2.1%, a difference of 0.28%), Dutch West Indian (2.1%, a difference of 0.33%), and Ugandan (2.0%, a difference of 0.35%).
| Demographics | Rating | Rank | No Schooling Completed |
| Chileans | 67.2 /100 | #156 | Good 2.0% |
| Immigrants | Sri Lanka | 67.0 /100 | #157 | Good 2.0% |
| Immigrants | Korea | 66.7 /100 | #158 | Good 2.0% |
| Immigrants | Spain | 66.4 /100 | #159 | Good 2.0% |
| Kenyans | 65.7 /100 | #160 | Good 2.0% |
| Ugandans | 64.6 /100 | #161 | Good 2.0% |
| Immigrants | Brazil | 63.8 /100 | #162 | Good 2.1% |
| Albanians | 62.2 /100 | #163 | Good 2.1% |
| Comanche | 60.7 /100 | #164 | Good 2.1% |
| Brazilians | 60.2 /100 | #165 | Good 2.1% |
| Dutch West Indians | 59.9 /100 | #166 | Average 2.1% |
| Egyptians | 59.2 /100 | #167 | Average 2.1% |
| Cheyenne | 58.6 /100 | #168 | Average 2.1% |
| Apache | 56.7 /100 | #169 | Average 2.1% |
| Argentineans | 56.0 /100 | #170 | Average 2.1% |
Demographics Similar to Immigrants from Saudi Arabia by No Schooling Completed
In terms of no schooling completed, the demographic groups most similar to Immigrants from Saudi Arabia are Immigrants from Latvia (1.9%, a difference of 0.13%), Immigrants from Japan (1.9%, a difference of 0.28%), Okinawan (1.8%, a difference of 0.35%), Pueblo (1.9%, a difference of 0.47%), and Yugoslavian (1.8%, a difference of 0.57%).
| Demographics | Rating | Rank | No Schooling Completed |
| Immigrants | Switzerland | 97.9 /100 | #102 | Exceptional 1.8% |
| Basques | 97.9 /100 | #103 | Exceptional 1.8% |
| Thais | 97.5 /100 | #104 | Exceptional 1.8% |
| German Russians | 97.5 /100 | #105 | Exceptional 1.8% |
| Immigrants | France | 97.3 /100 | #106 | Exceptional 1.8% |
| Yugoslavians | 97.2 /100 | #107 | Exceptional 1.8% |
| Okinawans | 97.1 /100 | #108 | Exceptional 1.8% |
| Immigrants | Saudi Arabia | 96.8 /100 | #109 | Exceptional 1.9% |
| Immigrants | Latvia | 96.7 /100 | #110 | Exceptional 1.9% |
| Immigrants | Japan | 96.6 /100 | #111 | Exceptional 1.9% |
| Pueblo | 96.4 /100 | #112 | Exceptional 1.9% |
| Immigrants | Zimbabwe | 96.2 /100 | #113 | Exceptional 1.9% |
| Immigrants | Norway | 96.1 /100 | #114 | Exceptional 1.9% |
| Syrians | 96.0 /100 | #115 | Exceptional 1.9% |
| Lebanese | 96.0 /100 | #116 | Exceptional 1.9% |