Immigrants from Africa vs Immigrants from Western Asia No Schooling Completed
COMPARE
Immigrants from Africa
Immigrants from Western Asia
No Schooling Completed
No Schooling Completed Comparison
Immigrants from Africa
Immigrants from Western Asia
2.4%
NO SCHOOLING COMPLETED
1.1/ 100
METRIC RATING
251st/ 347
METRIC RANK
2.3%
NO SCHOOLING COMPLETED
2.6/ 100
METRIC RATING
235th/ 347
METRIC RANK
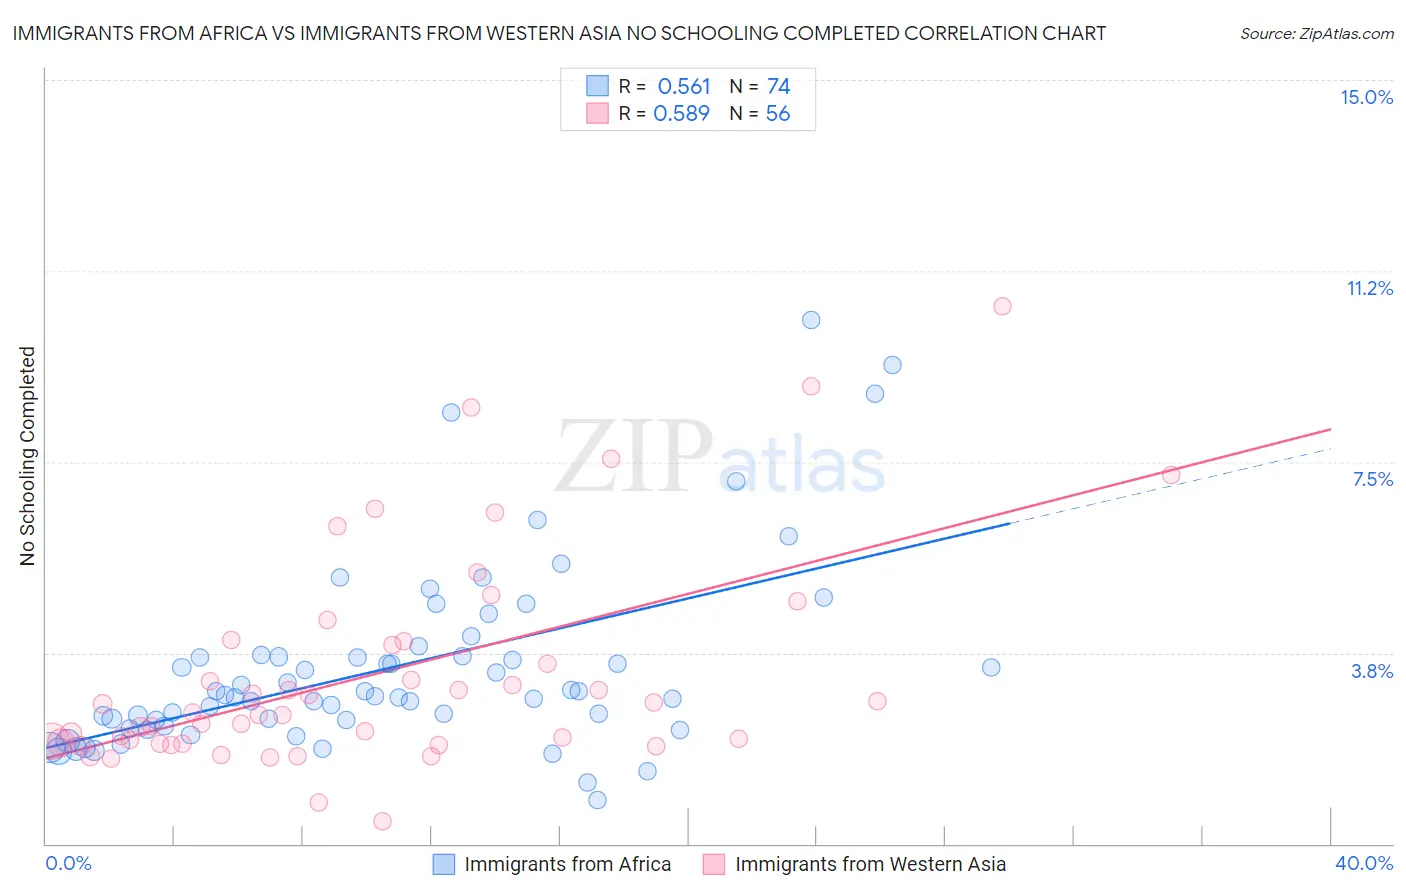
Immigrants from Africa vs Immigrants from Western Asia No Schooling Completed Correlation Chart
The statistical analysis conducted on geographies consisting of 463,296,246 people shows a substantial positive correlation between the proportion of Immigrants from Africa and percentage of population with no schooling in the United States with a correlation coefficient (R) of 0.561 and weighted average of 2.4%. Similarly, the statistical analysis conducted on geographies consisting of 400,576,161 people shows a substantial positive correlation between the proportion of Immigrants from Western Asia and percentage of population with no schooling in the United States with a correlation coefficient (R) of 0.589 and weighted average of 2.3%, a difference of 2.5%.
No Schooling Completed Correlation Summary
| Measurement | Immigrants from Africa | Immigrants from Western Asia |
| Minimum | 0.86% | 0.45% |
| Maximum | 10.3% | 10.6% |
| Range | 9.4% | 10.1% |
| Mean | 3.5% | 3.3% |
| Median | 2.9% | 2.5% |
| Interquartile 25% (IQ1) | 2.4% | 2.0% |
| Interquartile 75% (IQ3) | 3.7% | 3.9% |
| Interquartile Range (IQR) | 1.2% | 2.0% |
| Standard Deviation (Sample) | 1.8% | 2.1% |
| Standard Deviation (Population) | 1.8% | 2.1% |
Demographics Similar to Immigrants from Africa and Immigrants from Western Asia by No Schooling Completed
In terms of no schooling completed, the demographic groups most similar to Immigrants from Africa are Immigrants from Middle Africa (2.4%, a difference of 0.020%), Jamaican (2.4%, a difference of 0.070%), Asian (2.4%, a difference of 0.25%), Immigrants from Colombia (2.4%, a difference of 0.45%), and Immigrants from Iraq (2.4%, a difference of 0.52%). Similarly, the demographic groups most similar to Immigrants from Western Asia are Nigerian (2.3%, a difference of 0.020%), Immigrants from Malaysia (2.3%, a difference of 0.27%), Iraqi (2.4%, a difference of 0.54%), Immigrants from Eastern Asia (2.4%, a difference of 0.74%), and Paiute (2.4%, a difference of 0.95%).
| Demographics | Rating | Rank | No Schooling Completed |
| Immigrants | Malaysia | 2.8 /100 | #233 | Tragic 2.3% |
| Nigerians | 2.6 /100 | #234 | Tragic 2.3% |
| Immigrants | Western Asia | 2.6 /100 | #235 | Tragic 2.3% |
| Iraqis | 2.2 /100 | #236 | Tragic 2.4% |
| Immigrants | Eastern Asia | 2.0 /100 | #237 | Tragic 2.4% |
| Paiute | 1.9 /100 | #238 | Tragic 2.4% |
| Liberians | 1.8 /100 | #239 | Tragic 2.4% |
| Immigrants | Senegal | 1.7 /100 | #240 | Tragic 2.4% |
| Koreans | 1.7 /100 | #241 | Tragic 2.4% |
| Immigrants | Indonesia | 1.5 /100 | #242 | Tragic 2.4% |
| South Americans | 1.5 /100 | #243 | Tragic 2.4% |
| Peruvians | 1.4 /100 | #244 | Tragic 2.4% |
| Bolivians | 1.4 /100 | #245 | Tragic 2.4% |
| Immigrants | Congo | 1.4 /100 | #246 | Tragic 2.4% |
| Immigrants | Iraq | 1.3 /100 | #247 | Tragic 2.4% |
| Asians | 1.2 /100 | #248 | Tragic 2.4% |
| Jamaicans | 1.2 /100 | #249 | Tragic 2.4% |
| Immigrants | Middle Africa | 1.1 /100 | #250 | Tragic 2.4% |
| Immigrants | Africa | 1.1 /100 | #251 | Tragic 2.4% |
| Immigrants | Colombia | 1.0 /100 | #252 | Tragic 2.4% |
| Immigrants | Asia | 0.9 /100 | #253 | Tragic 2.4% |