Costa Rican vs Immigrants from Western Asia No Schooling Completed
COMPARE
Costa Rican
Immigrants from Western Asia
No Schooling Completed
No Schooling Completed Comparison
Costa Ricans
Immigrants from Western Asia
2.2%
NO SCHOOLING COMPLETED
17.1/ 100
METRIC RATING
201st/ 347
METRIC RANK
2.3%
NO SCHOOLING COMPLETED
2.6/ 100
METRIC RATING
235th/ 347
METRIC RANK
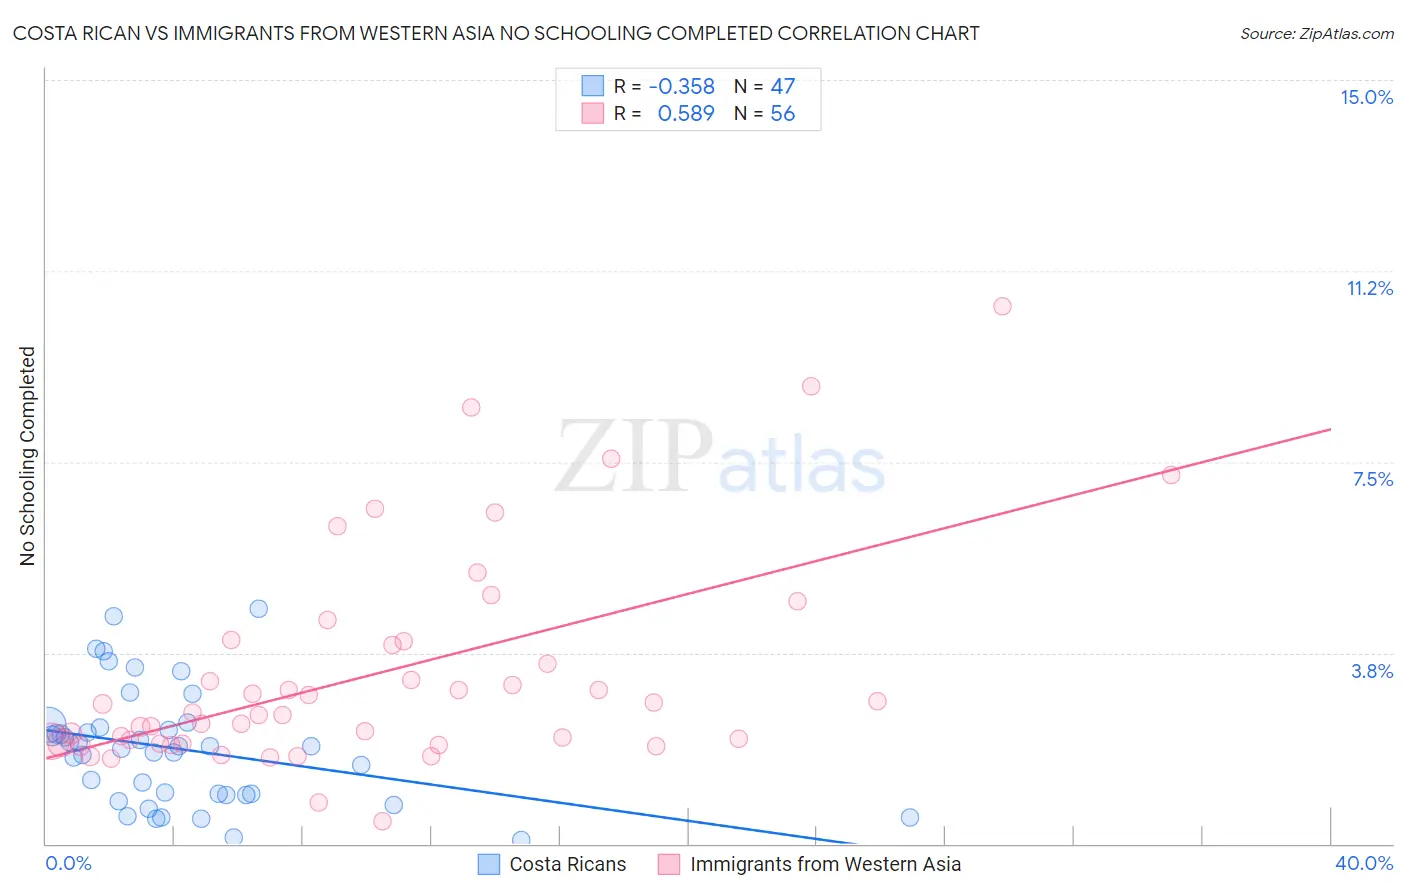
Costa Rican vs Immigrants from Western Asia No Schooling Completed Correlation Chart
The statistical analysis conducted on geographies consisting of 252,541,850 people shows a mild negative correlation between the proportion of Costa Ricans and percentage of population with no schooling in the United States with a correlation coefficient (R) of -0.358 and weighted average of 2.2%. Similarly, the statistical analysis conducted on geographies consisting of 400,576,161 people shows a substantial positive correlation between the proportion of Immigrants from Western Asia and percentage of population with no schooling in the United States with a correlation coefficient (R) of 0.589 and weighted average of 2.3%, a difference of 6.5%.
No Schooling Completed Correlation Summary
| Measurement | Costa Rican | Immigrants from Western Asia |
| Minimum | 0.080% | 0.45% |
| Maximum | 4.6% | 10.6% |
| Range | 4.5% | 10.1% |
| Mean | 1.9% | 3.3% |
| Median | 1.9% | 2.5% |
| Interquartile 25% (IQ1) | 0.97% | 2.0% |
| Interquartile 75% (IQ3) | 2.3% | 3.9% |
| Interquartile Range (IQR) | 1.3% | 2.0% |
| Standard Deviation (Sample) | 1.1% | 2.1% |
| Standard Deviation (Population) | 1.1% | 2.1% |
Similar Demographics by No Schooling Completed
Demographics Similar to Costa Ricans by No Schooling Completed
In terms of no schooling completed, the demographic groups most similar to Costa Ricans are Immigrants from Northern Africa (2.2%, a difference of 0.52%), Moroccan (2.2%, a difference of 0.82%), Laotian (2.2%, a difference of 0.93%), African (2.2%, a difference of 0.98%), and Hopi (2.2%, a difference of 1.0%).
| Demographics | Rating | Rank | No Schooling Completed |
| Immigrants | Albania | 28.3 /100 | #194 | Fair 2.2% |
| Hawaiians | 27.0 /100 | #195 | Fair 2.2% |
| Immigrants | Ukraine | 26.1 /100 | #196 | Fair 2.2% |
| Immigrants | Southern Europe | 23.8 /100 | #197 | Fair 2.2% |
| Immigrants | Chile | 22.7 /100 | #198 | Fair 2.2% |
| Africans | 21.8 /100 | #199 | Fair 2.2% |
| Immigrants | Northern Africa | 19.5 /100 | #200 | Poor 2.2% |
| Costa Ricans | 17.1 /100 | #201 | Poor 2.2% |
| Moroccans | 13.7 /100 | #202 | Poor 2.2% |
| Laotians | 13.3 /100 | #203 | Poor 2.2% |
| Hopi | 12.9 /100 | #204 | Poor 2.2% |
| Immigrants | Bahamas | 11.6 /100 | #205 | Poor 2.2% |
| Bahamians | 11.6 /100 | #206 | Poor 2.2% |
| South American Indians | 11.0 /100 | #207 | Poor 2.2% |
| Uruguayans | 11.0 /100 | #208 | Poor 2.2% |
Demographics Similar to Immigrants from Western Asia by No Schooling Completed
In terms of no schooling completed, the demographic groups most similar to Immigrants from Western Asia are Nigerian (2.3%, a difference of 0.020%), Immigrants from Malaysia (2.3%, a difference of 0.27%), Iraqi (2.4%, a difference of 0.54%), Colombian (2.3%, a difference of 0.62%), and Immigrants from Eastern Asia (2.4%, a difference of 0.74%).
| Demographics | Rating | Rank | No Schooling Completed |
| U.S. Virgin Islanders | 3.7 /100 | #228 | Tragic 2.3% |
| Immigrants | Pakistan | 3.6 /100 | #229 | Tragic 2.3% |
| Puerto Ricans | 3.4 /100 | #230 | Tragic 2.3% |
| Immigrants | Uruguay | 3.4 /100 | #231 | Tragic 2.3% |
| Colombians | 3.2 /100 | #232 | Tragic 2.3% |
| Immigrants | Malaysia | 2.8 /100 | #233 | Tragic 2.3% |
| Nigerians | 2.6 /100 | #234 | Tragic 2.3% |
| Immigrants | Western Asia | 2.6 /100 | #235 | Tragic 2.3% |
| Iraqis | 2.2 /100 | #236 | Tragic 2.4% |
| Immigrants | Eastern Asia | 2.0 /100 | #237 | Tragic 2.4% |
| Paiute | 1.9 /100 | #238 | Tragic 2.4% |
| Liberians | 1.8 /100 | #239 | Tragic 2.4% |
| Immigrants | Senegal | 1.7 /100 | #240 | Tragic 2.4% |
| Koreans | 1.7 /100 | #241 | Tragic 2.4% |
| Immigrants | Indonesia | 1.5 /100 | #242 | Tragic 2.4% |