Albanian vs Hawaiian No Schooling Completed
COMPARE
Albanian
Hawaiian
No Schooling Completed
No Schooling Completed Comparison
Albanians
Hawaiians
2.1%
NO SCHOOLING COMPLETED
62.2/ 100
METRIC RATING
163rd/ 347
METRIC RANK
2.2%
NO SCHOOLING COMPLETED
27.0/ 100
METRIC RATING
195th/ 347
METRIC RANK
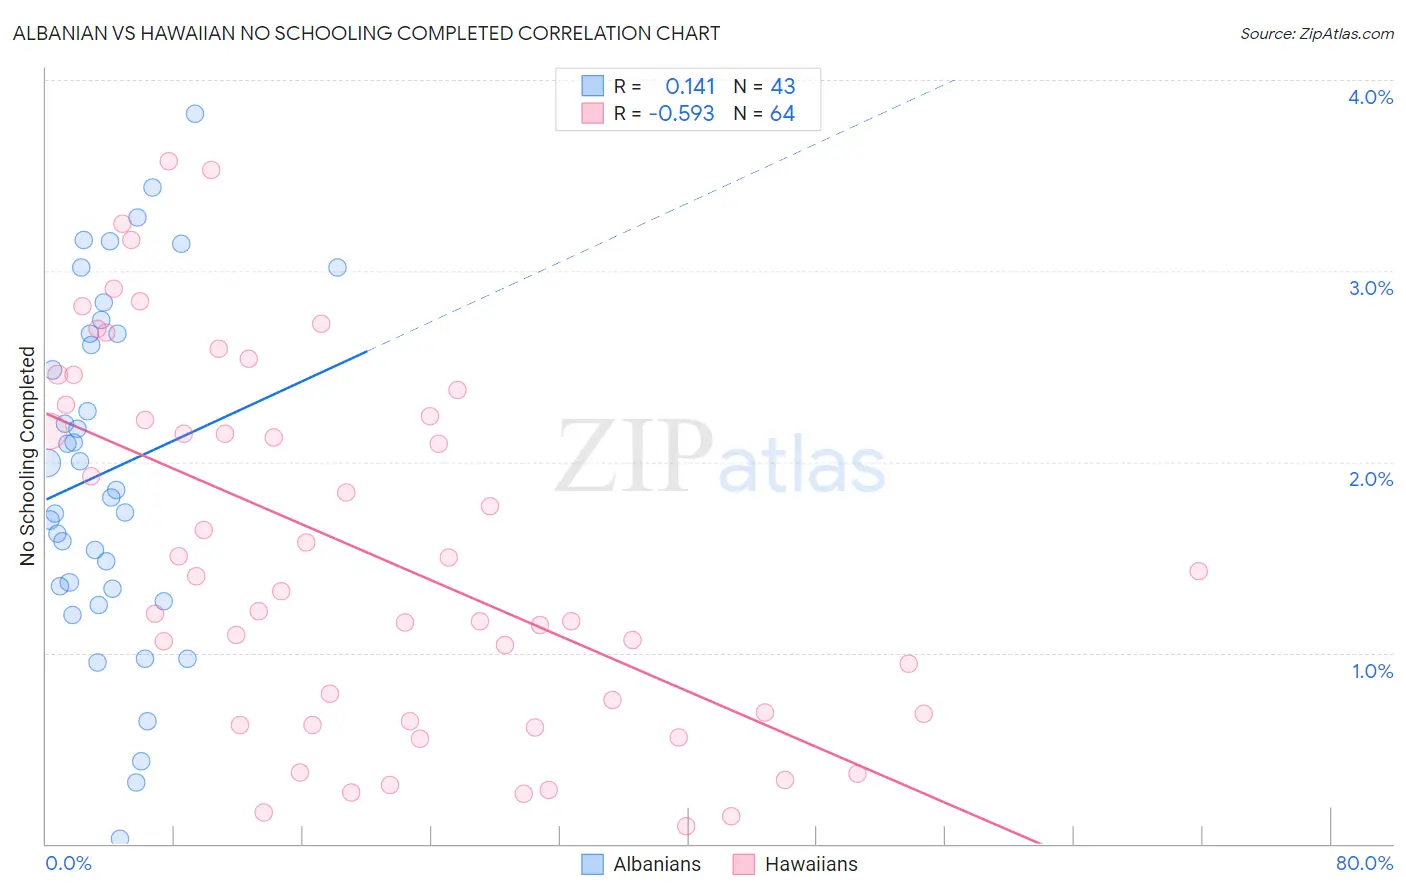
Albanian vs Hawaiian No Schooling Completed Correlation Chart
The statistical analysis conducted on geographies consisting of 192,057,216 people shows a poor positive correlation between the proportion of Albanians and percentage of population with no schooling in the United States with a correlation coefficient (R) of 0.141 and weighted average of 2.1%. Similarly, the statistical analysis conducted on geographies consisting of 324,490,486 people shows a substantial negative correlation between the proportion of Hawaiians and percentage of population with no schooling in the United States with a correlation coefficient (R) of -0.593 and weighted average of 2.2%, a difference of 5.1%.
No Schooling Completed Correlation Summary
| Measurement | Albanian | Hawaiian |
| Minimum | 0.028% | 0.093% |
| Maximum | 3.8% | 3.6% |
| Range | 3.8% | 3.5% |
| Mean | 2.0% | 1.5% |
| Median | 1.9% | 1.4% |
| Interquartile 25% (IQ1) | 1.3% | 0.66% |
| Interquartile 75% (IQ3) | 2.7% | 2.3% |
| Interquartile Range (IQR) | 1.3% | 1.6% |
| Standard Deviation (Sample) | 0.90% | 0.96% |
| Standard Deviation (Population) | 0.89% | 0.95% |
Similar Demographics by No Schooling Completed
Demographics Similar to Albanians by No Schooling Completed
In terms of no schooling completed, the demographic groups most similar to Albanians are Comanche (2.1%, a difference of 0.22%), Immigrants from Brazil (2.1%, a difference of 0.24%), Brazilian (2.1%, a difference of 0.28%), Dutch West Indian (2.1%, a difference of 0.33%), and Ugandan (2.0%, a difference of 0.35%).
| Demographics | Rating | Rank | No Schooling Completed |
| Chileans | 67.2 /100 | #156 | Good 2.0% |
| Immigrants | Sri Lanka | 67.0 /100 | #157 | Good 2.0% |
| Immigrants | Korea | 66.7 /100 | #158 | Good 2.0% |
| Immigrants | Spain | 66.4 /100 | #159 | Good 2.0% |
| Kenyans | 65.7 /100 | #160 | Good 2.0% |
| Ugandans | 64.6 /100 | #161 | Good 2.0% |
| Immigrants | Brazil | 63.8 /100 | #162 | Good 2.1% |
| Albanians | 62.2 /100 | #163 | Good 2.1% |
| Comanche | 60.7 /100 | #164 | Good 2.1% |
| Brazilians | 60.2 /100 | #165 | Good 2.1% |
| Dutch West Indians | 59.9 /100 | #166 | Average 2.1% |
| Egyptians | 59.2 /100 | #167 | Average 2.1% |
| Cheyenne | 58.6 /100 | #168 | Average 2.1% |
| Apache | 56.7 /100 | #169 | Average 2.1% |
| Argentineans | 56.0 /100 | #170 | Average 2.1% |
Demographics Similar to Hawaiians by No Schooling Completed
In terms of no schooling completed, the demographic groups most similar to Hawaiians are Immigrants from Ukraine (2.2%, a difference of 0.15%), Immigrants from Albania (2.2%, a difference of 0.20%), Paraguayan (2.2%, a difference of 0.37%), Guamanian/Chamorro (2.2%, a difference of 0.44%), and Immigrants from Southern Europe (2.2%, a difference of 0.56%).
| Demographics | Rating | Rank | No Schooling Completed |
| Immigrants | Kenya | 36.2 /100 | #188 | Fair 2.1% |
| Immigrants | Egypt | 36.1 /100 | #189 | Fair 2.1% |
| Spanish Americans | 32.6 /100 | #190 | Fair 2.1% |
| Bermudans | 30.7 /100 | #191 | Fair 2.1% |
| Guamanians/Chamorros | 29.8 /100 | #192 | Fair 2.2% |
| Paraguayans | 29.3 /100 | #193 | Fair 2.2% |
| Immigrants | Albania | 28.3 /100 | #194 | Fair 2.2% |
| Hawaiians | 27.0 /100 | #195 | Fair 2.2% |
| Immigrants | Ukraine | 26.1 /100 | #196 | Fair 2.2% |
| Immigrants | Southern Europe | 23.8 /100 | #197 | Fair 2.2% |
| Immigrants | Chile | 22.7 /100 | #198 | Fair 2.2% |
| Africans | 21.8 /100 | #199 | Fair 2.2% |
| Immigrants | Northern Africa | 19.5 /100 | #200 | Poor 2.2% |
| Costa Ricans | 17.1 /100 | #201 | Poor 2.2% |
| Moroccans | 13.7 /100 | #202 | Poor 2.2% |