Albanian vs Potawatomi No Schooling Completed
COMPARE
Albanian
Potawatomi
No Schooling Completed
No Schooling Completed Comparison
Albanians
Potawatomi
2.1%
NO SCHOOLING COMPLETED
62.2/ 100
METRIC RATING
163rd/ 347
METRIC RANK
1.7%
NO SCHOOLING COMPLETED
99.3/ 100
METRIC RATING
83rd/ 347
METRIC RANK
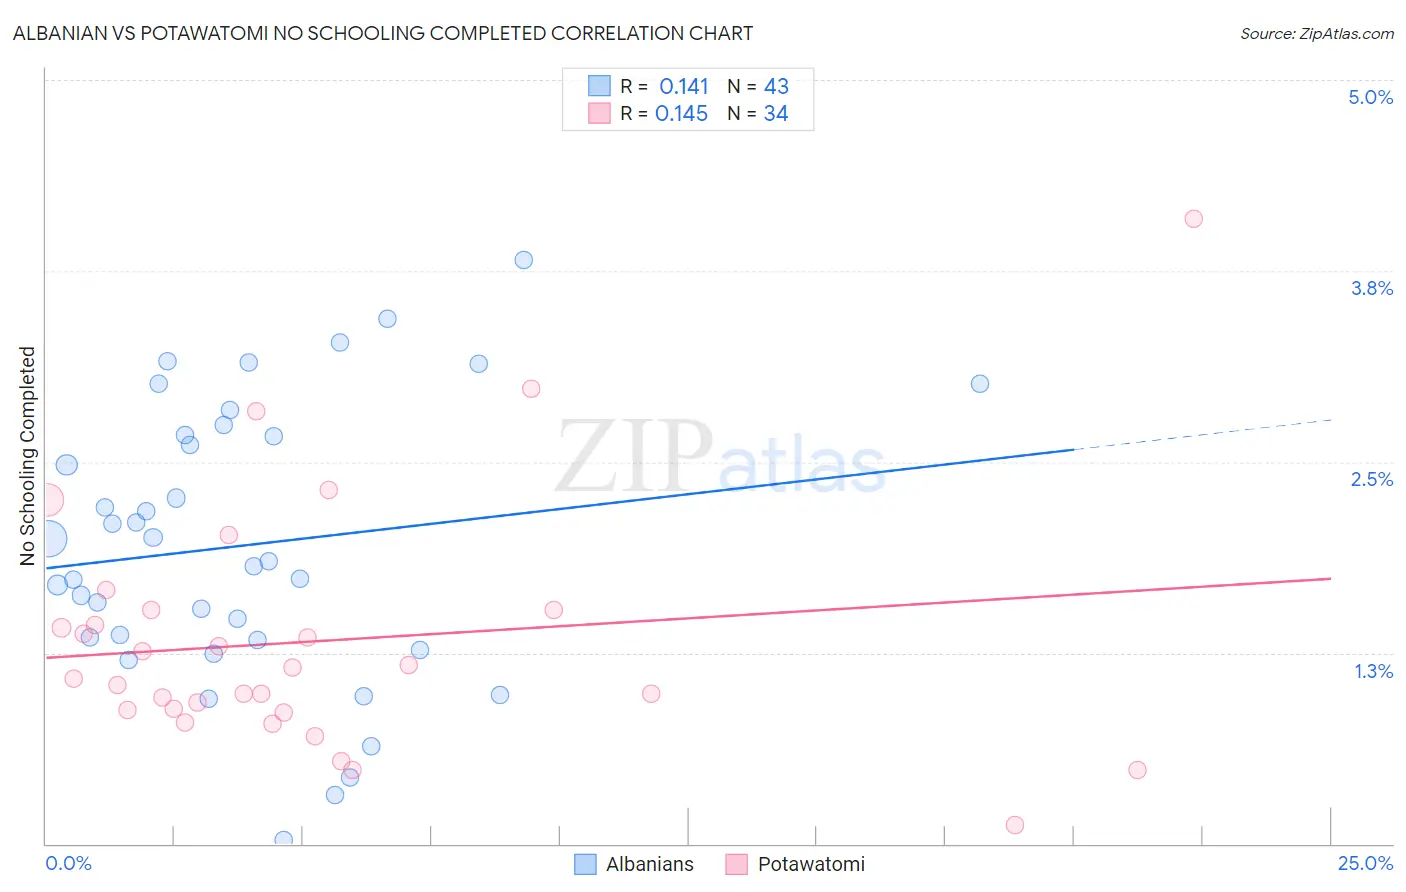
Albanian vs Potawatomi No Schooling Completed Correlation Chart
The statistical analysis conducted on geographies consisting of 192,057,216 people shows a poor positive correlation between the proportion of Albanians and percentage of population with no schooling in the United States with a correlation coefficient (R) of 0.141 and weighted average of 2.1%. Similarly, the statistical analysis conducted on geographies consisting of 117,110,177 people shows a poor positive correlation between the proportion of Potawatomi and percentage of population with no schooling in the United States with a correlation coefficient (R) of 0.145 and weighted average of 1.7%, a difference of 17.6%.
No Schooling Completed Correlation Summary
| Measurement | Albanian | Potawatomi |
| Minimum | 0.028% | 0.12% |
| Maximum | 3.8% | 4.1% |
| Range | 3.8% | 4.0% |
| Mean | 2.0% | 1.3% |
| Median | 1.9% | 1.1% |
| Interquartile 25% (IQ1) | 1.3% | 0.88% |
| Interquartile 75% (IQ3) | 2.7% | 1.5% |
| Interquartile Range (IQR) | 1.3% | 0.65% |
| Standard Deviation (Sample) | 0.90% | 0.80% |
| Standard Deviation (Population) | 0.89% | 0.79% |
Similar Demographics by No Schooling Completed
Demographics Similar to Albanians by No Schooling Completed
In terms of no schooling completed, the demographic groups most similar to Albanians are Comanche (2.1%, a difference of 0.22%), Immigrants from Brazil (2.1%, a difference of 0.24%), Brazilian (2.1%, a difference of 0.28%), Dutch West Indian (2.1%, a difference of 0.33%), and Ugandan (2.0%, a difference of 0.35%).
| Demographics | Rating | Rank | No Schooling Completed |
| Chileans | 67.2 /100 | #156 | Good 2.0% |
| Immigrants | Sri Lanka | 67.0 /100 | #157 | Good 2.0% |
| Immigrants | Korea | 66.7 /100 | #158 | Good 2.0% |
| Immigrants | Spain | 66.4 /100 | #159 | Good 2.0% |
| Kenyans | 65.7 /100 | #160 | Good 2.0% |
| Ugandans | 64.6 /100 | #161 | Good 2.0% |
| Immigrants | Brazil | 63.8 /100 | #162 | Good 2.1% |
| Albanians | 62.2 /100 | #163 | Good 2.1% |
| Comanche | 60.7 /100 | #164 | Good 2.1% |
| Brazilians | 60.2 /100 | #165 | Good 2.1% |
| Dutch West Indians | 59.9 /100 | #166 | Average 2.1% |
| Egyptians | 59.2 /100 | #167 | Average 2.1% |
| Cheyenne | 58.6 /100 | #168 | Average 2.1% |
| Apache | 56.7 /100 | #169 | Average 2.1% |
| Argentineans | 56.0 /100 | #170 | Average 2.1% |
Demographics Similar to Potawatomi by No Schooling Completed
In terms of no schooling completed, the demographic groups most similar to Potawatomi are Immigrants from Denmark (1.7%, a difference of 0.050%), Immigrants from Australia (1.7%, a difference of 0.090%), Immigrants from South Africa (1.7%, a difference of 0.11%), Ukrainian (1.8%, a difference of 0.14%), and Icelander (1.7%, a difference of 0.20%).
| Demographics | Rating | Rank | No Schooling Completed |
| Cherokee | 99.3 /100 | #76 | Exceptional 1.7% |
| Immigrants | Sweden | 99.3 /100 | #77 | Exceptional 1.7% |
| Delaware | 99.3 /100 | #78 | Exceptional 1.7% |
| Macedonians | 99.3 /100 | #79 | Exceptional 1.7% |
| Cypriots | 99.3 /100 | #80 | Exceptional 1.7% |
| Icelanders | 99.3 /100 | #81 | Exceptional 1.7% |
| Immigrants | South Africa | 99.3 /100 | #82 | Exceptional 1.7% |
| Potawatomi | 99.3 /100 | #83 | Exceptional 1.7% |
| Immigrants | Denmark | 99.2 /100 | #84 | Exceptional 1.7% |
| Immigrants | Australia | 99.2 /100 | #85 | Exceptional 1.7% |
| Ukrainians | 99.2 /100 | #86 | Exceptional 1.8% |
| Osage | 99.2 /100 | #87 | Exceptional 1.8% |
| Immigrants | Western Europe | 99.2 /100 | #88 | Exceptional 1.8% |
| South Africans | 99.1 /100 | #89 | Exceptional 1.8% |
| Sioux | 99.0 /100 | #90 | Exceptional 1.8% |