Black/African American vs Immigrants from Western Asia No Schooling Completed
COMPARE
Black/African American
Immigrants from Western Asia
No Schooling Completed
No Schooling Completed Comparison
Blacks/African Americans
Immigrants from Western Asia
2.1%
NO SCHOOLING COMPLETED
41.4/ 100
METRIC RATING
183rd/ 347
METRIC RANK
2.3%
NO SCHOOLING COMPLETED
2.6/ 100
METRIC RATING
235th/ 347
METRIC RANK
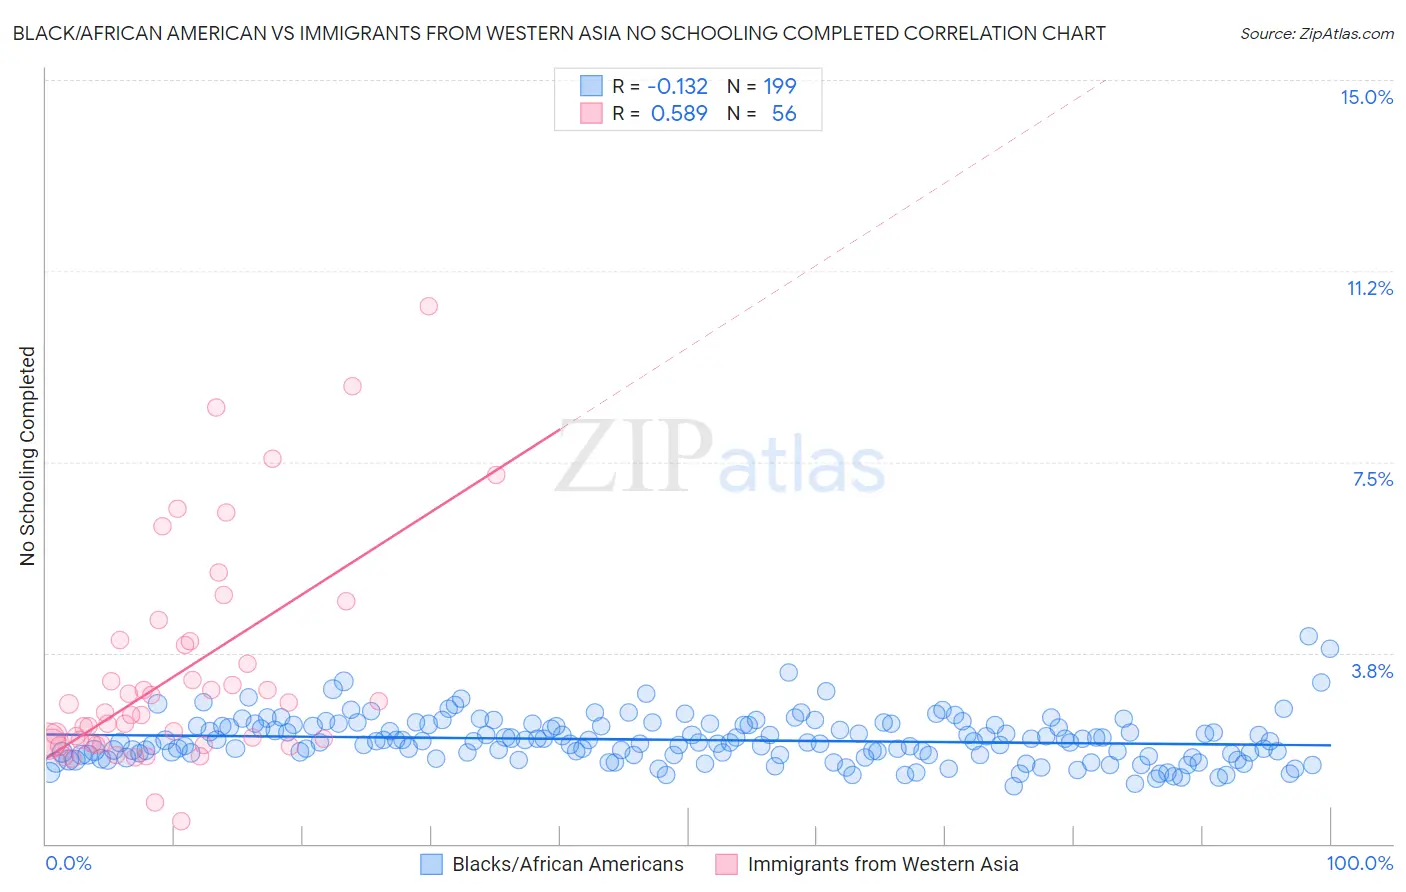
Black/African American vs Immigrants from Western Asia No Schooling Completed Correlation Chart
The statistical analysis conducted on geographies consisting of 551,024,391 people shows a poor negative correlation between the proportion of Blacks/African Americans and percentage of population with no schooling in the United States with a correlation coefficient (R) of -0.132 and weighted average of 2.1%. Similarly, the statistical analysis conducted on geographies consisting of 400,576,161 people shows a substantial positive correlation between the proportion of Immigrants from Western Asia and percentage of population with no schooling in the United States with a correlation coefficient (R) of 0.589 and weighted average of 2.3%, a difference of 10.9%.
No Schooling Completed Correlation Summary
| Measurement | Black/African American | Immigrants from Western Asia |
| Minimum | 1.1% | 0.45% |
| Maximum | 4.1% | 10.6% |
| Range | 2.9% | 10.1% |
| Mean | 2.0% | 3.3% |
| Median | 2.0% | 2.5% |
| Interquartile 25% (IQ1) | 1.7% | 2.0% |
| Interquartile 75% (IQ3) | 2.3% | 3.9% |
| Interquartile Range (IQR) | 0.59% | 2.0% |
| Standard Deviation (Sample) | 0.46% | 2.1% |
| Standard Deviation (Population) | 0.46% | 2.1% |
Similar Demographics by No Schooling Completed
Demographics Similar to Blacks/African Americans by No Schooling Completed
In terms of no schooling completed, the demographic groups most similar to Blacks/African Americans are Pima (2.1%, a difference of 0.020%), Mongolian (2.1%, a difference of 0.090%), French American Indian (2.1%, a difference of 0.10%), Immigrants from Taiwan (2.1%, a difference of 0.15%), and Portuguese (2.1%, a difference of 0.33%).
| Demographics | Rating | Rank | No Schooling Completed |
| Panamanians | 45.2 /100 | #176 | Average 2.1% |
| Arapaho | 45.0 /100 | #177 | Average 2.1% |
| Pakistanis | 44.7 /100 | #178 | Average 2.1% |
| Immigrants | Kazakhstan | 44.3 /100 | #179 | Average 2.1% |
| Portuguese | 43.9 /100 | #180 | Average 2.1% |
| Immigrants | Taiwan | 42.6 /100 | #181 | Average 2.1% |
| French American Indians | 42.2 /100 | #182 | Average 2.1% |
| Blacks/African Americans | 41.4 /100 | #183 | Average 2.1% |
| Pima | 41.3 /100 | #184 | Average 2.1% |
| Mongolians | 40.8 /100 | #185 | Average 2.1% |
| Immigrants | Bosnia and Herzegovina | 38.6 /100 | #186 | Fair 2.1% |
| Navajo | 36.5 /100 | #187 | Fair 2.1% |
| Immigrants | Kenya | 36.2 /100 | #188 | Fair 2.1% |
| Immigrants | Egypt | 36.1 /100 | #189 | Fair 2.1% |
| Spanish Americans | 32.6 /100 | #190 | Fair 2.1% |
Demographics Similar to Immigrants from Western Asia by No Schooling Completed
In terms of no schooling completed, the demographic groups most similar to Immigrants from Western Asia are Nigerian (2.3%, a difference of 0.020%), Immigrants from Malaysia (2.3%, a difference of 0.27%), Iraqi (2.4%, a difference of 0.54%), Colombian (2.3%, a difference of 0.62%), and Immigrants from Eastern Asia (2.4%, a difference of 0.74%).
| Demographics | Rating | Rank | No Schooling Completed |
| U.S. Virgin Islanders | 3.7 /100 | #228 | Tragic 2.3% |
| Immigrants | Pakistan | 3.6 /100 | #229 | Tragic 2.3% |
| Puerto Ricans | 3.4 /100 | #230 | Tragic 2.3% |
| Immigrants | Uruguay | 3.4 /100 | #231 | Tragic 2.3% |
| Colombians | 3.2 /100 | #232 | Tragic 2.3% |
| Immigrants | Malaysia | 2.8 /100 | #233 | Tragic 2.3% |
| Nigerians | 2.6 /100 | #234 | Tragic 2.3% |
| Immigrants | Western Asia | 2.6 /100 | #235 | Tragic 2.3% |
| Iraqis | 2.2 /100 | #236 | Tragic 2.4% |
| Immigrants | Eastern Asia | 2.0 /100 | #237 | Tragic 2.4% |
| Paiute | 1.9 /100 | #238 | Tragic 2.4% |
| Liberians | 1.8 /100 | #239 | Tragic 2.4% |
| Immigrants | Senegal | 1.7 /100 | #240 | Tragic 2.4% |
| Koreans | 1.7 /100 | #241 | Tragic 2.4% |
| Immigrants | Indonesia | 1.5 /100 | #242 | Tragic 2.4% |