Albanian vs Immigrants from Western Asia 9th Grade
COMPARE
Albanian
Immigrants from Western Asia
9th Grade
9th Grade Comparison
Albanians
Immigrants from Western Asia
95.1%
9TH GRADE
76.1/ 100
METRIC RATING
153rd/ 347
METRIC RANK
94.5%
9TH GRADE
10.7/ 100
METRIC RATING
216th/ 347
METRIC RANK
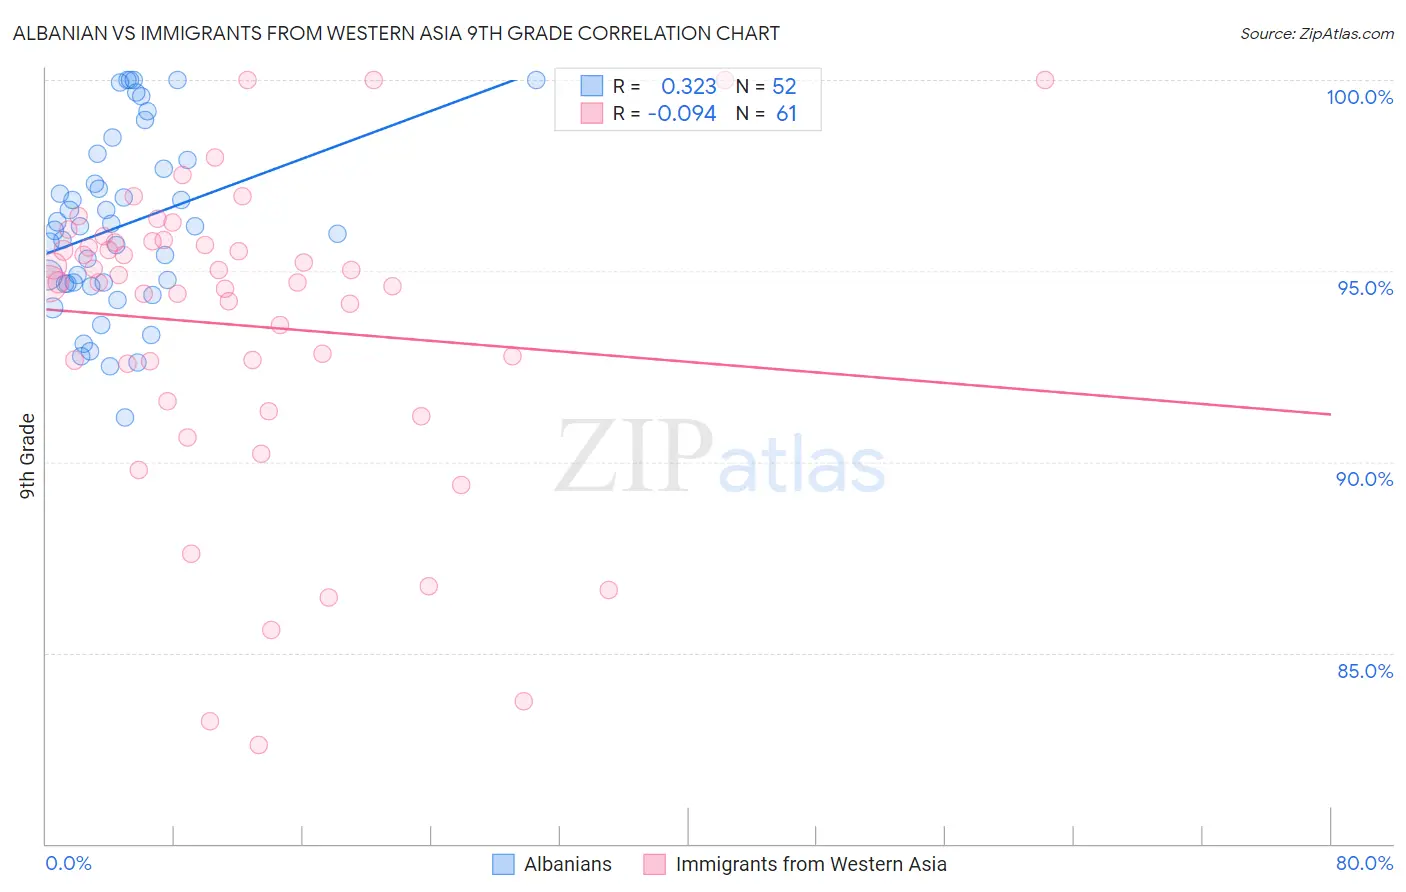
Albanian vs Immigrants from Western Asia 9th Grade Correlation Chart
The statistical analysis conducted on geographies consisting of 193,265,850 people shows a mild positive correlation between the proportion of Albanians and percentage of population with at least 9th grade education in the United States with a correlation coefficient (R) of 0.323 and weighted average of 95.1%. Similarly, the statistical analysis conducted on geographies consisting of 404,433,811 people shows a slight negative correlation between the proportion of Immigrants from Western Asia and percentage of population with at least 9th grade education in the United States with a correlation coefficient (R) of -0.094 and weighted average of 94.5%, a difference of 0.60%.
9th Grade Correlation Summary
| Measurement | Albanian | Immigrants from Western Asia |
| Minimum | 91.2% | 82.6% |
| Maximum | 100.0% | 100.0% |
| Range | 8.8% | 17.4% |
| Mean | 96.2% | 93.6% |
| Median | 96.1% | 94.7% |
| Interquartile 25% (IQ1) | 94.7% | 92.1% |
| Interquartile 75% (IQ3) | 97.8% | 95.8% |
| Interquartile Range (IQR) | 3.1% | 3.7% |
| Standard Deviation (Sample) | 2.3% | 4.0% |
| Standard Deviation (Population) | 2.3% | 4.0% |
Similar Demographics by 9th Grade
Demographics Similar to Albanians by 9th Grade
In terms of 9th grade, the demographic groups most similar to Albanians are Cajun (95.1%, a difference of 0.010%), Ugandan (95.1%, a difference of 0.010%), Arab (95.1%, a difference of 0.010%), Immigrants from Kazakhstan (95.1%, a difference of 0.010%), and Kenyan (95.1%, a difference of 0.030%).
| Demographics | Rating | Rank | 9th Grade |
| Immigrants | Sri Lanka | 82.1 /100 | #146 | Excellent 95.1% |
| Choctaw | 81.9 /100 | #147 | Excellent 95.1% |
| Immigrants | Jordan | 81.2 /100 | #148 | Excellent 95.1% |
| Immigrants | Korea | 79.6 /100 | #149 | Good 95.1% |
| Kenyans | 79.1 /100 | #150 | Good 95.1% |
| Cajuns | 77.3 /100 | #151 | Good 95.1% |
| Ugandans | 77.0 /100 | #152 | Good 95.1% |
| Albanians | 76.1 /100 | #153 | Good 95.1% |
| Arabs | 74.9 /100 | #154 | Good 95.1% |
| Immigrants | Kazakhstan | 74.7 /100 | #155 | Good 95.1% |
| Immigrants | Kenya | 73.1 /100 | #156 | Good 95.0% |
| Mongolians | 73.0 /100 | #157 | Good 95.0% |
| Egyptians | 70.1 /100 | #158 | Good 95.0% |
| Immigrants | Ukraine | 67.4 /100 | #159 | Good 95.0% |
| Immigrants | Italy | 66.6 /100 | #160 | Good 95.0% |
Demographics Similar to Immigrants from Western Asia by 9th Grade
In terms of 9th grade, the demographic groups most similar to Immigrants from Western Asia are Immigrants from Syria (94.5%, a difference of 0.010%), Immigrants from Liberia (94.5%, a difference of 0.020%), Asian (94.5%, a difference of 0.020%), Immigrants from Indonesia (94.5%, a difference of 0.030%), and Immigrants from Malaysia (94.5%, a difference of 0.030%).
| Demographics | Rating | Rank | 9th Grade |
| Comanche | 14.9 /100 | #209 | Poor 94.6% |
| Immigrants | Chile | 13.4 /100 | #210 | Poor 94.5% |
| Immigrants | Indonesia | 12.3 /100 | #211 | Poor 94.5% |
| Immigrants | Malaysia | 12.2 /100 | #212 | Poor 94.5% |
| Immigrants | Oceania | 12.1 /100 | #213 | Poor 94.5% |
| Immigrants | Liberia | 11.8 /100 | #214 | Poor 94.5% |
| Immigrants | Syria | 11.0 /100 | #215 | Poor 94.5% |
| Immigrants | Western Asia | 10.7 /100 | #216 | Poor 94.5% |
| Asians | 9.9 /100 | #217 | Tragic 94.5% |
| Portuguese | 9.2 /100 | #218 | Tragic 94.5% |
| Africans | 9.0 /100 | #219 | Tragic 94.5% |
| Indians (Asian) | 8.6 /100 | #220 | Tragic 94.5% |
| Immigrants | Eastern Africa | 8.2 /100 | #221 | Tragic 94.5% |
| Immigrants | Asia | 7.7 /100 | #222 | Tragic 94.4% |
| Bahamians | 7.0 /100 | #223 | Tragic 94.4% |