Albanian vs Spanish No Schooling Completed
COMPARE
Albanian
Spanish
No Schooling Completed
No Schooling Completed Comparison
Albanians
Spanish
2.1%
NO SCHOOLING COMPLETED
62.2/ 100
METRIC RATING
163rd/ 347
METRIC RANK
1.9%
NO SCHOOLING COMPLETED
95.5/ 100
METRIC RATING
118th/ 347
METRIC RANK
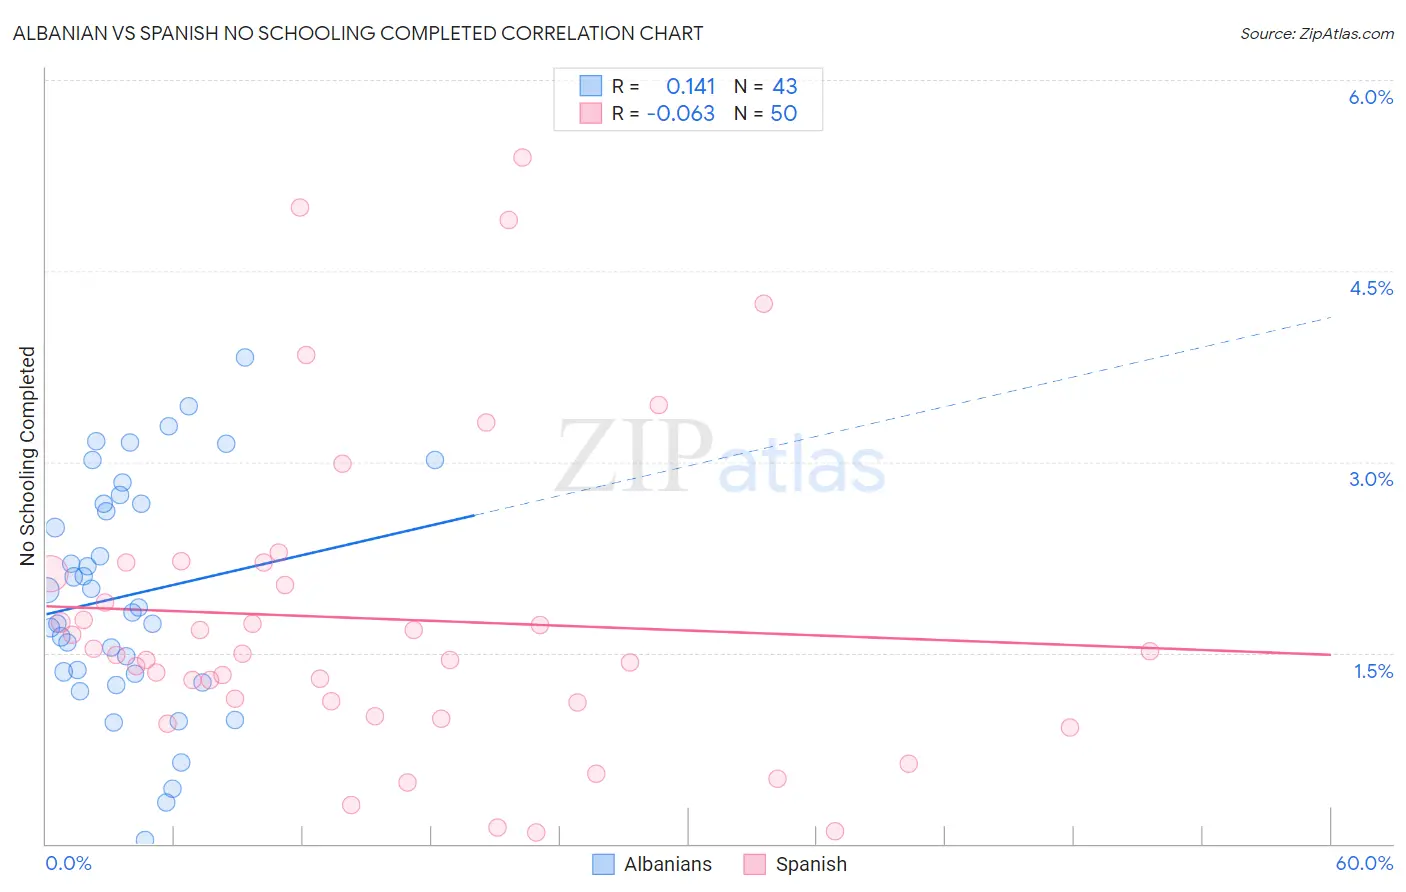
Albanian vs Spanish No Schooling Completed Correlation Chart
The statistical analysis conducted on geographies consisting of 192,057,216 people shows a poor positive correlation between the proportion of Albanians and percentage of population with no schooling in the United States with a correlation coefficient (R) of 0.141 and weighted average of 2.1%. Similarly, the statistical analysis conducted on geographies consisting of 416,846,352 people shows a slight negative correlation between the proportion of Spanish and percentage of population with no schooling in the United States with a correlation coefficient (R) of -0.063 and weighted average of 1.9%, a difference of 9.6%.
No Schooling Completed Correlation Summary
| Measurement | Albanian | Spanish |
| Minimum | 0.028% | 0.088% |
| Maximum | 3.8% | 5.4% |
| Range | 3.8% | 5.3% |
| Mean | 2.0% | 1.8% |
| Median | 1.9% | 1.5% |
| Interquartile 25% (IQ1) | 1.3% | 1.1% |
| Interquartile 75% (IQ3) | 2.7% | 2.1% |
| Interquartile Range (IQR) | 1.3% | 1.0% |
| Standard Deviation (Sample) | 0.90% | 1.2% |
| Standard Deviation (Population) | 0.89% | 1.2% |
Similar Demographics by No Schooling Completed
Demographics Similar to Albanians by No Schooling Completed
In terms of no schooling completed, the demographic groups most similar to Albanians are Comanche (2.1%, a difference of 0.22%), Immigrants from Brazil (2.1%, a difference of 0.24%), Brazilian (2.1%, a difference of 0.28%), Dutch West Indian (2.1%, a difference of 0.33%), and Ugandan (2.0%, a difference of 0.35%).
| Demographics | Rating | Rank | No Schooling Completed |
| Chileans | 67.2 /100 | #156 | Good 2.0% |
| Immigrants | Sri Lanka | 67.0 /100 | #157 | Good 2.0% |
| Immigrants | Korea | 66.7 /100 | #158 | Good 2.0% |
| Immigrants | Spain | 66.4 /100 | #159 | Good 2.0% |
| Kenyans | 65.7 /100 | #160 | Good 2.0% |
| Ugandans | 64.6 /100 | #161 | Good 2.0% |
| Immigrants | Brazil | 63.8 /100 | #162 | Good 2.1% |
| Albanians | 62.2 /100 | #163 | Good 2.1% |
| Comanche | 60.7 /100 | #164 | Good 2.1% |
| Brazilians | 60.2 /100 | #165 | Good 2.1% |
| Dutch West Indians | 59.9 /100 | #166 | Average 2.1% |
| Egyptians | 59.2 /100 | #167 | Average 2.1% |
| Cheyenne | 58.6 /100 | #168 | Average 2.1% |
| Apache | 56.7 /100 | #169 | Average 2.1% |
| Argentineans | 56.0 /100 | #170 | Average 2.1% |
Demographics Similar to Spanish by No Schooling Completed
In terms of no schooling completed, the demographic groups most similar to Spanish are Immigrants from Serbia (1.9%, a difference of 0.24%), Iroquois (1.9%, a difference of 0.35%), Lebanese (1.9%, a difference of 0.44%), Syrian (1.9%, a difference of 0.46%), and Immigrants from Norway (1.9%, a difference of 0.59%).
| Demographics | Rating | Rank | No Schooling Completed |
| Immigrants | Japan | 96.6 /100 | #111 | Exceptional 1.9% |
| Pueblo | 96.4 /100 | #112 | Exceptional 1.9% |
| Immigrants | Zimbabwe | 96.2 /100 | #113 | Exceptional 1.9% |
| Immigrants | Norway | 96.1 /100 | #114 | Exceptional 1.9% |
| Syrians | 96.0 /100 | #115 | Exceptional 1.9% |
| Lebanese | 96.0 /100 | #116 | Exceptional 1.9% |
| Immigrants | Serbia | 95.8 /100 | #117 | Exceptional 1.9% |
| Spanish | 95.5 /100 | #118 | Exceptional 1.9% |
| Iroquois | 95.1 /100 | #119 | Exceptional 1.9% |
| Immigrants | Bulgaria | 94.6 /100 | #120 | Exceptional 1.9% |
| Immigrants | Croatia | 94.5 /100 | #121 | Exceptional 1.9% |
| Cree | 94.5 /100 | #122 | Exceptional 1.9% |
| Immigrants | Kuwait | 93.9 /100 | #123 | Exceptional 1.9% |
| Cambodians | 93.8 /100 | #124 | Exceptional 1.9% |
| Immigrants | Europe | 93.7 /100 | #125 | Exceptional 1.9% |