Carpatho Rusyn vs Immigrants from Uganda GED/Equivalency
COMPARE
Carpatho Rusyn
Immigrants from Uganda
GED/Equivalency
GED/Equivalency Comparison
Carpatho Rusyns
Immigrants from Uganda
89.1%
GED/EQUIVALENCY
99.9/ 100
METRIC RATING
8th/ 347
METRIC RANK
85.7%
GED/EQUIVALENCY
45.2/ 100
METRIC RATING
177th/ 347
METRIC RANK
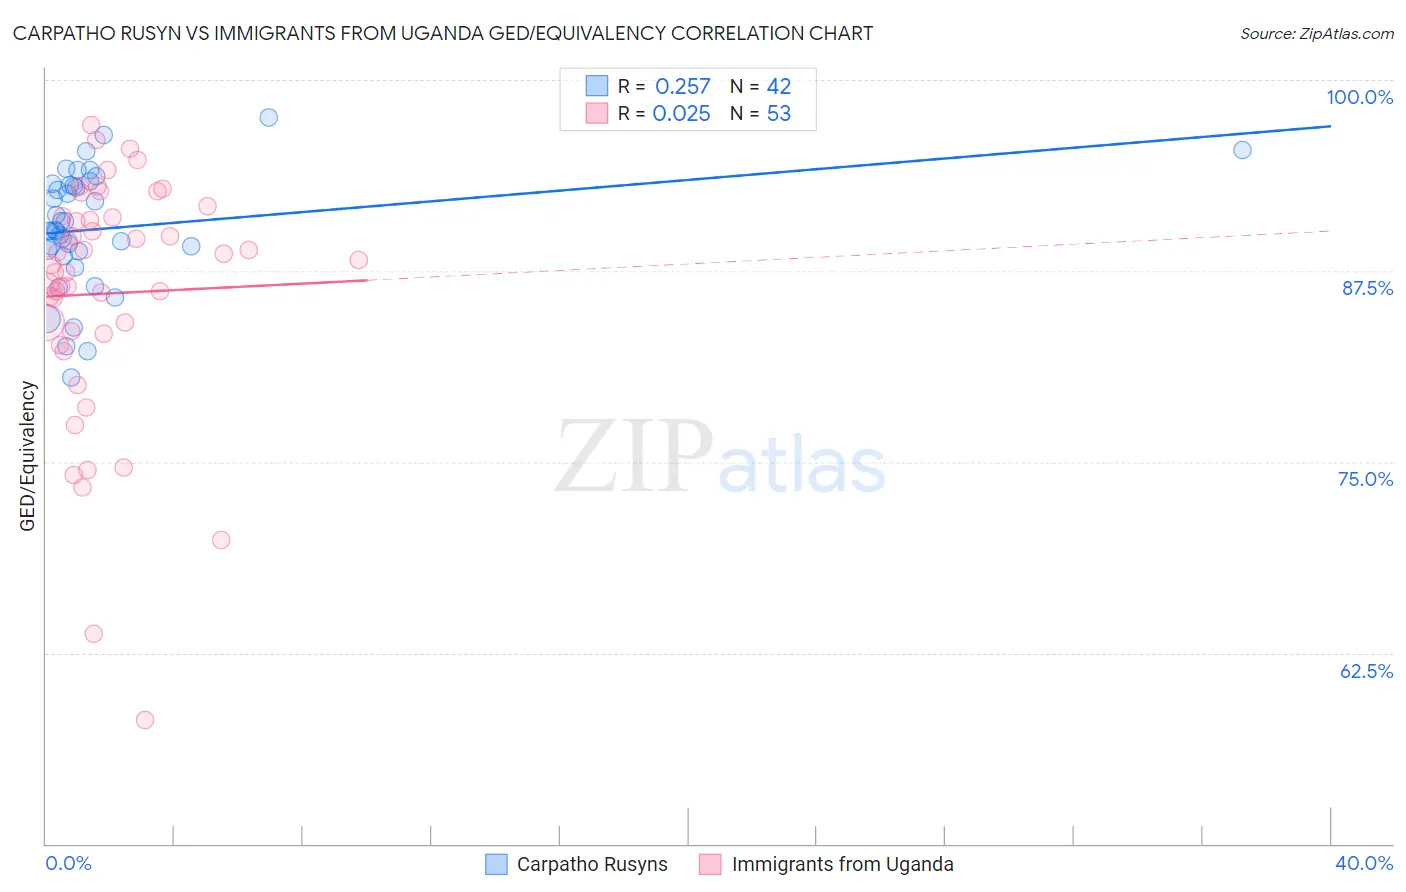
Carpatho Rusyn vs Immigrants from Uganda GED/Equivalency Correlation Chart
The statistical analysis conducted on geographies consisting of 58,871,690 people shows a weak positive correlation between the proportion of Carpatho Rusyns and percentage of population with at least ged/equivalency education in the United States with a correlation coefficient (R) of 0.257 and weighted average of 89.1%. Similarly, the statistical analysis conducted on geographies consisting of 125,982,219 people shows no correlation between the proportion of Immigrants from Uganda and percentage of population with at least ged/equivalency education in the United States with a correlation coefficient (R) of 0.025 and weighted average of 85.7%, a difference of 4.0%.
GED/Equivalency Correlation Summary
| Measurement | Carpatho Rusyn | Immigrants from Uganda |
| Minimum | 80.5% | 58.1% |
| Maximum | 97.5% | 97.1% |
| Range | 17.0% | 39.0% |
| Mean | 90.3% | 86.0% |
| Median | 90.2% | 87.9% |
| Interquartile 25% (IQ1) | 88.8% | 83.5% |
| Interquartile 75% (IQ3) | 93.2% | 91.1% |
| Interquartile Range (IQR) | 4.3% | 7.6% |
| Standard Deviation (Sample) | 3.9% | 8.0% |
| Standard Deviation (Population) | 3.9% | 7.9% |
Similar Demographics by GED/Equivalency
Demographics Similar to Carpatho Rusyns by GED/Equivalency
In terms of ged/equivalency, the demographic groups most similar to Carpatho Rusyns are Chinese (89.0%, a difference of 0.020%), Eastern European (89.1%, a difference of 0.050%), Norwegian (89.0%, a difference of 0.070%), Thai (89.1%, a difference of 0.090%), and Bulgarian (89.0%, a difference of 0.10%).
| Demographics | Rating | Rank | GED/Equivalency |
| Immigrants | India | 100.0 /100 | #1 | Exceptional 89.7% |
| Filipinos | 100.0 /100 | #2 | Exceptional 89.5% |
| Immigrants | Singapore | 100.0 /100 | #3 | Exceptional 89.3% |
| Iranians | 100.0 /100 | #4 | Exceptional 89.2% |
| Latvians | 100.0 /100 | #5 | Exceptional 89.2% |
| Thais | 100.0 /100 | #6 | Exceptional 89.1% |
| Eastern Europeans | 99.9 /100 | #7 | Exceptional 89.1% |
| Carpatho Rusyns | 99.9 /100 | #8 | Exceptional 89.1% |
| Chinese | 99.9 /100 | #9 | Exceptional 89.0% |
| Norwegians | 99.9 /100 | #10 | Exceptional 89.0% |
| Bulgarians | 99.9 /100 | #11 | Exceptional 89.0% |
| Lithuanians | 99.9 /100 | #12 | Exceptional 88.9% |
| Immigrants | Iran | 99.9 /100 | #13 | Exceptional 88.9% |
| Cypriots | 99.9 /100 | #14 | Exceptional 88.9% |
| Okinawans | 99.9 /100 | #15 | Exceptional 88.9% |
Demographics Similar to Immigrants from Uganda by GED/Equivalency
In terms of ged/equivalency, the demographic groups most similar to Immigrants from Uganda are Immigrants from Eastern Africa (85.7%, a difference of 0.050%), Korean (85.6%, a difference of 0.080%), Ottawa (85.8%, a difference of 0.10%), Immigrants from Bolivia (85.8%, a difference of 0.10%), and Aleut (85.6%, a difference of 0.10%).
| Demographics | Rating | Rank | GED/Equivalency |
| Afghans | 59.7 /100 | #170 | Average 85.9% |
| Immigrants | Chile | 57.3 /100 | #171 | Average 85.9% |
| Bermudans | 55.1 /100 | #172 | Average 85.8% |
| Immigrants | Venezuela | 50.7 /100 | #173 | Average 85.8% |
| Ottawa | 50.0 /100 | #174 | Average 85.8% |
| Immigrants | Bolivia | 49.8 /100 | #175 | Average 85.8% |
| Immigrants | Eastern Africa | 47.7 /100 | #176 | Average 85.7% |
| Immigrants | Uganda | 45.2 /100 | #177 | Average 85.7% |
| Koreans | 41.2 /100 | #178 | Average 85.6% |
| Aleuts | 40.5 /100 | #179 | Average 85.6% |
| Immigrants | Southern Europe | 38.4 /100 | #180 | Fair 85.5% |
| Moroccans | 37.7 /100 | #181 | Fair 85.5% |
| Sudanese | 35.2 /100 | #182 | Fair 85.5% |
| Immigrants | Sudan | 34.2 /100 | #183 | Fair 85.5% |
| Immigrants | Oceania | 33.6 /100 | #184 | Fair 85.5% |