African vs Immigrants from Uganda GED/Equivalency
COMPARE
African
Immigrants from Uganda
GED/Equivalency
GED/Equivalency Comparison
Africans
Immigrants from Uganda
83.4%
GED/EQUIVALENCY
0.5/ 100
METRIC RATING
256th/ 347
METRIC RANK
85.7%
GED/EQUIVALENCY
45.2/ 100
METRIC RATING
177th/ 347
METRIC RANK
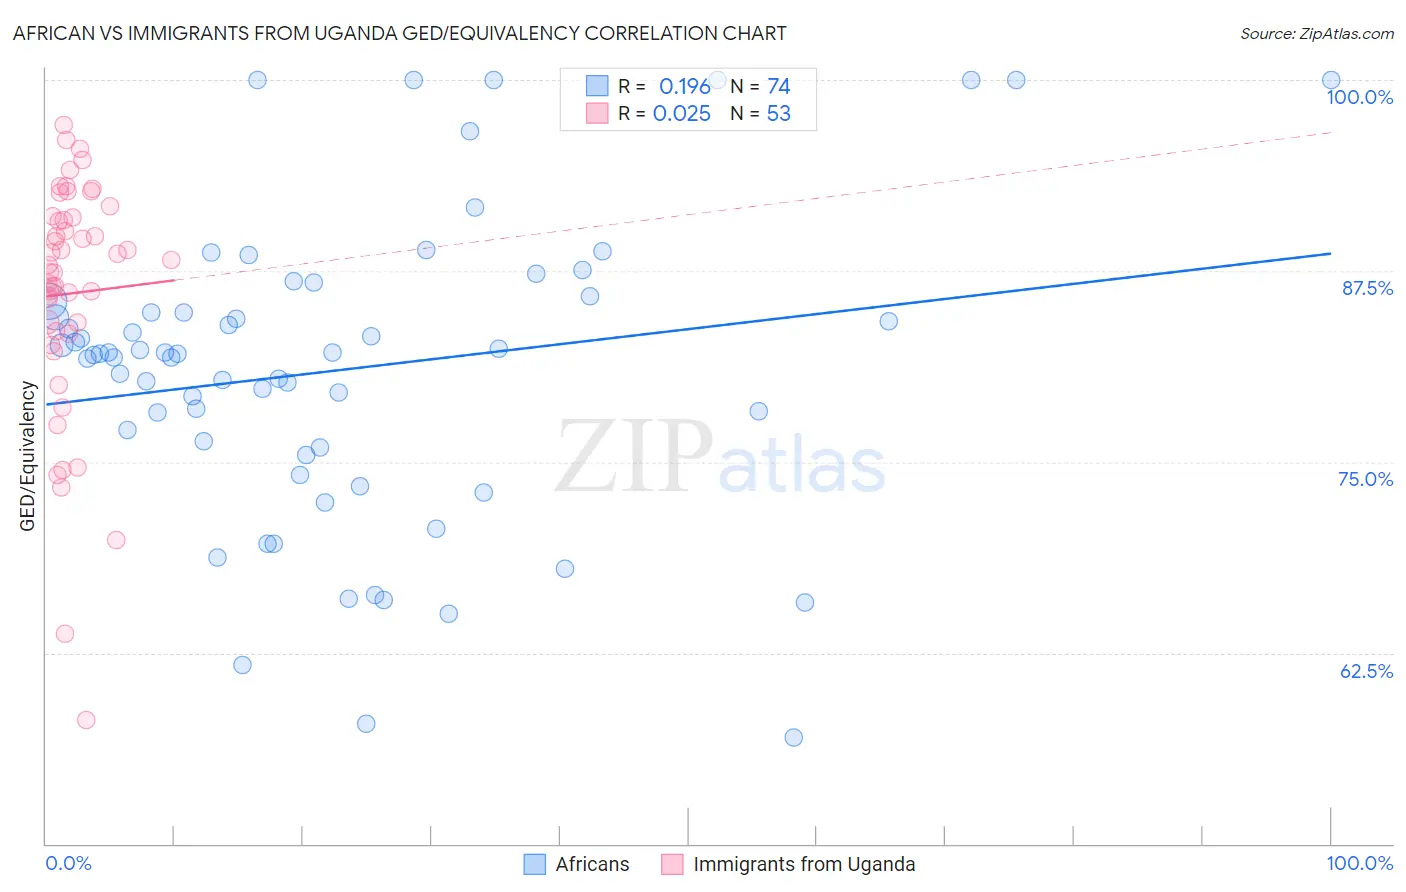
African vs Immigrants from Uganda GED/Equivalency Correlation Chart
The statistical analysis conducted on geographies consisting of 470,092,963 people shows a poor positive correlation between the proportion of Africans and percentage of population with at least ged/equivalency education in the United States with a correlation coefficient (R) of 0.196 and weighted average of 83.4%. Similarly, the statistical analysis conducted on geographies consisting of 125,982,219 people shows no correlation between the proportion of Immigrants from Uganda and percentage of population with at least ged/equivalency education in the United States with a correlation coefficient (R) of 0.025 and weighted average of 85.7%, a difference of 2.7%.
GED/Equivalency Correlation Summary
| Measurement | African | Immigrants from Uganda |
| Minimum | 56.9% | 58.1% |
| Maximum | 100.0% | 97.1% |
| Range | 43.1% | 39.0% |
| Mean | 81.0% | 86.0% |
| Median | 82.1% | 87.9% |
| Interquartile 25% (IQ1) | 75.9% | 83.5% |
| Interquartile 75% (IQ3) | 85.5% | 91.1% |
| Interquartile Range (IQR) | 9.6% | 7.6% |
| Standard Deviation (Sample) | 9.9% | 8.0% |
| Standard Deviation (Population) | 9.8% | 7.9% |
Similar Demographics by GED/Equivalency
Demographics Similar to Africans by GED/Equivalency
In terms of ged/equivalency, the demographic groups most similar to Africans are Colville (83.4%, a difference of 0.010%), Jamaican (83.3%, a difference of 0.13%), Malaysian (83.3%, a difference of 0.16%), Creek (83.6%, a difference of 0.18%), and Comanche (83.6%, a difference of 0.20%).
| Demographics | Rating | Rank | GED/Equivalency |
| Crow | 1.1 /100 | #249 | Tragic 83.8% |
| Shoshone | 1.0 /100 | #250 | Tragic 83.7% |
| Spanish Americans | 0.8 /100 | #251 | Tragic 83.6% |
| Bahamians | 0.8 /100 | #252 | Tragic 83.6% |
| Comanche | 0.7 /100 | #253 | Tragic 83.6% |
| Creek | 0.7 /100 | #254 | Tragic 83.6% |
| Colville | 0.5 /100 | #255 | Tragic 83.4% |
| Africans | 0.5 /100 | #256 | Tragic 83.4% |
| Jamaicans | 0.4 /100 | #257 | Tragic 83.3% |
| Malaysians | 0.4 /100 | #258 | Tragic 83.3% |
| Immigrants | Vietnam | 0.3 /100 | #259 | Tragic 83.2% |
| Choctaw | 0.3 /100 | #260 | Tragic 83.1% |
| Inupiat | 0.2 /100 | #261 | Tragic 83.1% |
| Immigrants | Armenia | 0.2 /100 | #262 | Tragic 83.1% |
| Immigrants | Congo | 0.2 /100 | #263 | Tragic 83.1% |
Demographics Similar to Immigrants from Uganda by GED/Equivalency
In terms of ged/equivalency, the demographic groups most similar to Immigrants from Uganda are Immigrants from Eastern Africa (85.7%, a difference of 0.050%), Korean (85.6%, a difference of 0.080%), Ottawa (85.8%, a difference of 0.10%), Immigrants from Bolivia (85.8%, a difference of 0.10%), and Aleut (85.6%, a difference of 0.10%).
| Demographics | Rating | Rank | GED/Equivalency |
| Afghans | 59.7 /100 | #170 | Average 85.9% |
| Immigrants | Chile | 57.3 /100 | #171 | Average 85.9% |
| Bermudans | 55.1 /100 | #172 | Average 85.8% |
| Immigrants | Venezuela | 50.7 /100 | #173 | Average 85.8% |
| Ottawa | 50.0 /100 | #174 | Average 85.8% |
| Immigrants | Bolivia | 49.8 /100 | #175 | Average 85.8% |
| Immigrants | Eastern Africa | 47.7 /100 | #176 | Average 85.7% |
| Immigrants | Uganda | 45.2 /100 | #177 | Average 85.7% |
| Koreans | 41.2 /100 | #178 | Average 85.6% |
| Aleuts | 40.5 /100 | #179 | Average 85.6% |
| Immigrants | Southern Europe | 38.4 /100 | #180 | Fair 85.5% |
| Moroccans | 37.7 /100 | #181 | Fair 85.5% |
| Sudanese | 35.2 /100 | #182 | Fair 85.5% |
| Immigrants | Sudan | 34.2 /100 | #183 | Fair 85.5% |
| Immigrants | Oceania | 33.6 /100 | #184 | Fair 85.5% |