Albanian vs Immigrants from Congo Professional Degree
COMPARE
Albanian
Immigrants from Congo
Professional Degree
Professional Degree Comparison
Albanians
Immigrants from Congo
4.9%
PROFESSIONAL DEGREE
95.3/ 100
METRIC RATING
120th/ 347
METRIC RANK
3.6%
PROFESSIONAL DEGREE
0.8/ 100
METRIC RATING
265th/ 347
METRIC RANK
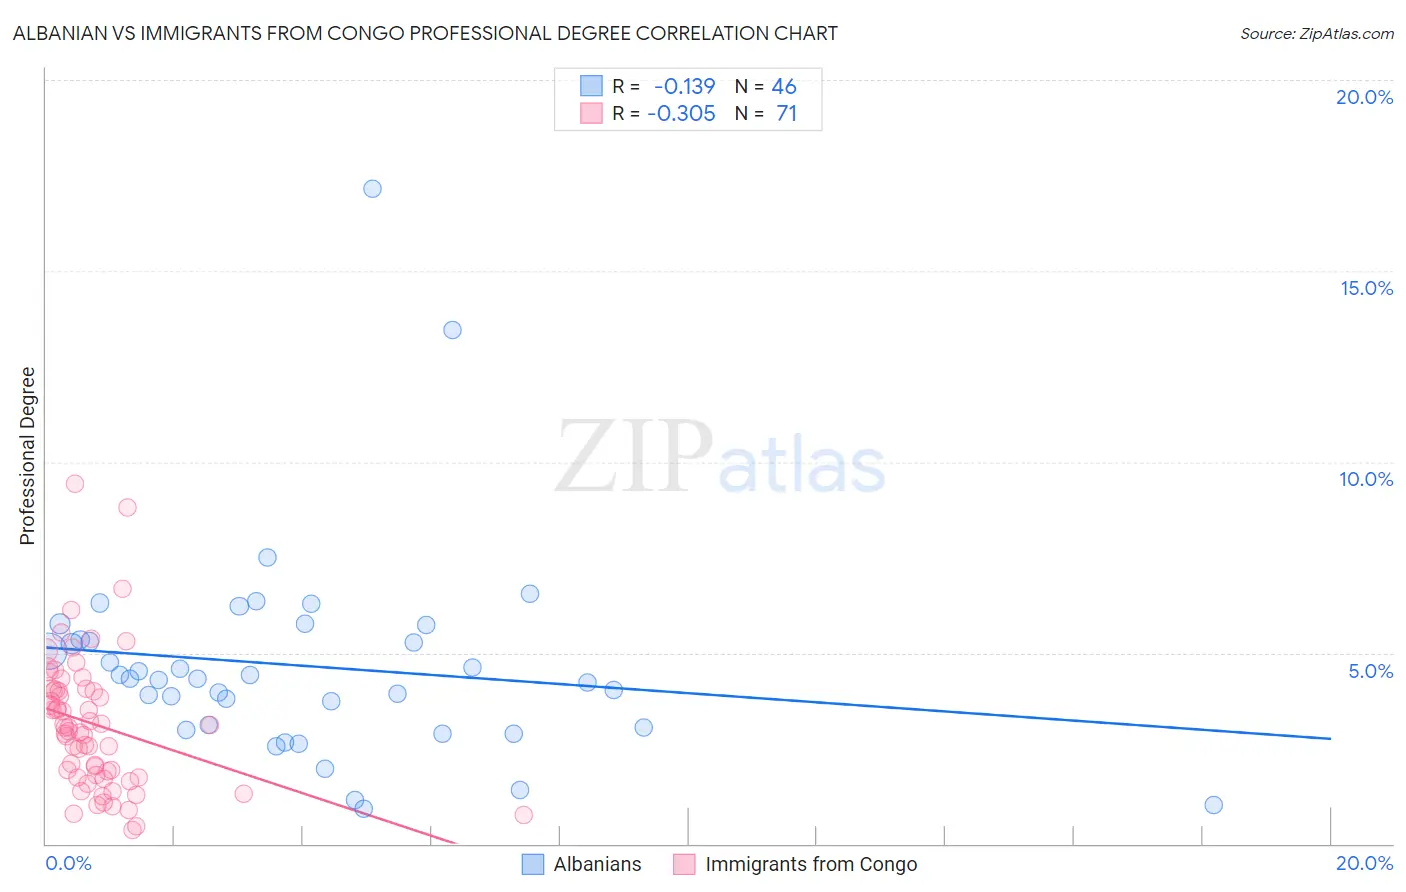
Albanian vs Immigrants from Congo Professional Degree Correlation Chart
The statistical analysis conducted on geographies consisting of 193,107,529 people shows a poor negative correlation between the proportion of Albanians and percentage of population with at least professional degree education in the United States with a correlation coefficient (R) of -0.139 and weighted average of 4.9%. Similarly, the statistical analysis conducted on geographies consisting of 92,025,437 people shows a mild negative correlation between the proportion of Immigrants from Congo and percentage of population with at least professional degree education in the United States with a correlation coefficient (R) of -0.305 and weighted average of 3.6%, a difference of 34.2%.
Professional Degree Correlation Summary
| Measurement | Albanian | Immigrants from Congo |
| Minimum | 0.91% | 0.35% |
| Maximum | 17.1% | 9.4% |
| Range | 16.2% | 9.1% |
| Mean | 4.7% | 3.1% |
| Median | 4.3% | 3.0% |
| Interquartile 25% (IQ1) | 3.0% | 1.7% |
| Interquartile 75% (IQ3) | 5.3% | 4.0% |
| Interquartile Range (IQR) | 2.3% | 2.3% |
| Standard Deviation (Sample) | 2.8% | 1.8% |
| Standard Deviation (Population) | 2.8% | 1.8% |
Similar Demographics by Professional Degree
Demographics Similar to Albanians by Professional Degree
In terms of professional degree, the demographic groups most similar to Albanians are Immigrants from Sudan (4.9%, a difference of 0.010%), Immigrants from Moldova (4.9%, a difference of 0.35%), Immigrants from Syria (4.9%, a difference of 0.55%), Croatian (4.9%, a difference of 0.55%), and Venezuelan (4.9%, a difference of 0.76%).
| Demographics | Rating | Rank | Professional Degree |
| Immigrants | Pakistan | 97.2 /100 | #113 | Exceptional 5.0% |
| Immigrants | Morocco | 96.8 /100 | #114 | Exceptional 5.0% |
| Moroccans | 96.8 /100 | #115 | Exceptional 5.0% |
| Venezuelans | 96.3 /100 | #116 | Exceptional 4.9% |
| Immigrants | Syria | 96.0 /100 | #117 | Exceptional 4.9% |
| Croatians | 96.0 /100 | #118 | Exceptional 4.9% |
| Immigrants | Sudan | 95.4 /100 | #119 | Exceptional 4.9% |
| Albanians | 95.3 /100 | #120 | Exceptional 4.9% |
| Immigrants | Moldova | 94.8 /100 | #121 | Exceptional 4.9% |
| Immigrants | Germany | 94.1 /100 | #122 | Exceptional 4.9% |
| Immigrants | Venezuela | 93.8 /100 | #123 | Exceptional 4.8% |
| Immigrants | Eritrea | 93.5 /100 | #124 | Exceptional 4.8% |
| Immigrants | Albania | 93.3 /100 | #125 | Exceptional 4.8% |
| Europeans | 93.2 /100 | #126 | Exceptional 4.8% |
| Serbians | 92.6 /100 | #127 | Exceptional 4.8% |
Demographics Similar to Immigrants from Congo by Professional Degree
In terms of professional degree, the demographic groups most similar to Immigrants from Congo are Immigrants from Cambodia (3.6%, a difference of 0.040%), Hopi (3.6%, a difference of 0.060%), Central American Indian (3.6%, a difference of 0.32%), U.S. Virgin Islander (3.7%, a difference of 0.56%), and Immigrants from Guyana (3.7%, a difference of 0.57%).
| Demographics | Rating | Rank | Professional Degree |
| Immigrants | St. Vincent and the Grenadines | 1.1 /100 | #258 | Tragic 3.7% |
| Africans | 1.0 /100 | #259 | Tragic 3.7% |
| Indonesians | 1.0 /100 | #260 | Tragic 3.7% |
| Immigrants | Guyana | 1.0 /100 | #261 | Tragic 3.7% |
| U.S. Virgin Islanders | 1.0 /100 | #262 | Tragic 3.7% |
| Hopi | 0.9 /100 | #263 | Tragic 3.6% |
| Immigrants | Cambodia | 0.9 /100 | #264 | Tragic 3.6% |
| Immigrants | Congo | 0.8 /100 | #265 | Tragic 3.6% |
| Central American Indians | 0.8 /100 | #266 | Tragic 3.6% |
| Delaware | 0.7 /100 | #267 | Tragic 3.6% |
| Aleuts | 0.7 /100 | #268 | Tragic 3.6% |
| Immigrants | Cuba | 0.6 /100 | #269 | Tragic 3.6% |
| Central Americans | 0.6 /100 | #270 | Tragic 3.6% |
| Belizeans | 0.5 /100 | #271 | Tragic 3.6% |
| Immigrants | Jamaica | 0.5 /100 | #272 | Tragic 3.6% |