Albanian vs Immigrants from Mexico Professional Degree
COMPARE
Albanian
Immigrants from Mexico
Professional Degree
Professional Degree Comparison
Albanians
Immigrants from Mexico
4.9%
PROFESSIONAL DEGREE
95.3/ 100
METRIC RATING
120th/ 347
METRIC RANK
2.6%
PROFESSIONAL DEGREE
0.0/ 100
METRIC RATING
345th/ 347
METRIC RANK
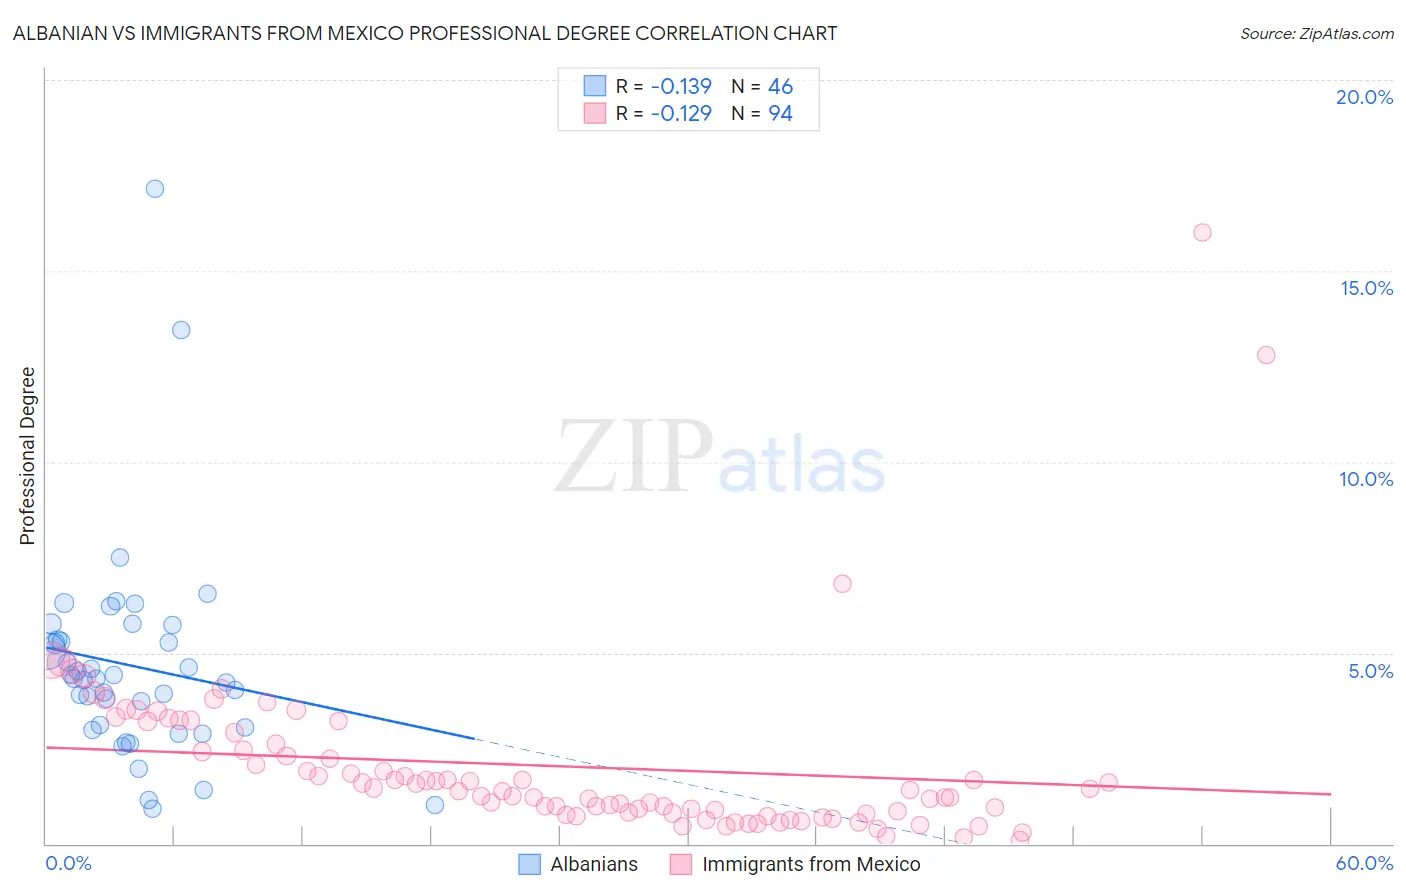
Albanian vs Immigrants from Mexico Professional Degree Correlation Chart
The statistical analysis conducted on geographies consisting of 193,107,529 people shows a poor negative correlation between the proportion of Albanians and percentage of population with at least professional degree education in the United States with a correlation coefficient (R) of -0.139 and weighted average of 4.9%. Similarly, the statistical analysis conducted on geographies consisting of 508,609,212 people shows a poor negative correlation between the proportion of Immigrants from Mexico and percentage of population with at least professional degree education in the United States with a correlation coefficient (R) of -0.129 and weighted average of 2.6%, a difference of 84.9%.
Professional Degree Correlation Summary
| Measurement | Albanian | Immigrants from Mexico |
| Minimum | 0.91% | 0.11% |
| Maximum | 17.1% | 16.0% |
| Range | 16.2% | 15.9% |
| Mean | 4.7% | 2.0% |
| Median | 4.3% | 1.4% |
| Interquartile 25% (IQ1) | 3.0% | 0.80% |
| Interquartile 75% (IQ3) | 5.3% | 2.6% |
| Interquartile Range (IQR) | 2.3% | 1.8% |
| Standard Deviation (Sample) | 2.8% | 2.3% |
| Standard Deviation (Population) | 2.8% | 2.3% |
Similar Demographics by Professional Degree
Demographics Similar to Albanians by Professional Degree
In terms of professional degree, the demographic groups most similar to Albanians are Immigrants from Sudan (4.9%, a difference of 0.010%), Immigrants from Moldova (4.9%, a difference of 0.35%), Immigrants from Syria (4.9%, a difference of 0.55%), Croatian (4.9%, a difference of 0.55%), and Venezuelan (4.9%, a difference of 0.76%).
| Demographics | Rating | Rank | Professional Degree |
| Immigrants | Pakistan | 97.2 /100 | #113 | Exceptional 5.0% |
| Immigrants | Morocco | 96.8 /100 | #114 | Exceptional 5.0% |
| Moroccans | 96.8 /100 | #115 | Exceptional 5.0% |
| Venezuelans | 96.3 /100 | #116 | Exceptional 4.9% |
| Immigrants | Syria | 96.0 /100 | #117 | Exceptional 4.9% |
| Croatians | 96.0 /100 | #118 | Exceptional 4.9% |
| Immigrants | Sudan | 95.4 /100 | #119 | Exceptional 4.9% |
| Albanians | 95.3 /100 | #120 | Exceptional 4.9% |
| Immigrants | Moldova | 94.8 /100 | #121 | Exceptional 4.9% |
| Immigrants | Germany | 94.1 /100 | #122 | Exceptional 4.9% |
| Immigrants | Venezuela | 93.8 /100 | #123 | Exceptional 4.8% |
| Immigrants | Eritrea | 93.5 /100 | #124 | Exceptional 4.8% |
| Immigrants | Albania | 93.3 /100 | #125 | Exceptional 4.8% |
| Europeans | 93.2 /100 | #126 | Exceptional 4.8% |
| Serbians | 92.6 /100 | #127 | Exceptional 4.8% |
Demographics Similar to Immigrants from Mexico by Professional Degree
In terms of professional degree, the demographic groups most similar to Immigrants from Mexico are Spanish American Indian (2.7%, a difference of 0.32%), Mexican (2.7%, a difference of 4.0%), Immigrants from the Azores (2.8%, a difference of 6.9%), Lumbee (2.5%, a difference of 7.4%), and Tohono O'odham (2.8%, a difference of 7.6%).
| Demographics | Rating | Rank | Professional Degree |
| Puget Sound Salish | 0.0 /100 | #333 | Tragic 3.1% |
| Pennsylvania Germans | 0.0 /100 | #334 | Tragic 3.0% |
| Natives/Alaskans | 0.0 /100 | #335 | Tragic 3.0% |
| Fijians | 0.0 /100 | #336 | Tragic 2.9% |
| Arapaho | 0.0 /100 | #337 | Tragic 2.9% |
| Navajo | 0.0 /100 | #338 | Tragic 2.9% |
| Immigrants | Central America | 0.0 /100 | #339 | Tragic 2.9% |
| Yup'ik | 0.0 /100 | #340 | Tragic 2.9% |
| Tohono O'odham | 0.0 /100 | #341 | Tragic 2.8% |
| Immigrants | Azores | 0.0 /100 | #342 | Tragic 2.8% |
| Mexicans | 0.0 /100 | #343 | Tragic 2.7% |
| Spanish American Indians | 0.0 /100 | #344 | Tragic 2.7% |
| Immigrants | Mexico | 0.0 /100 | #345 | Tragic 2.6% |
| Lumbee | 0.0 /100 | #346 | Tragic 2.5% |
| Houma | 0.0 /100 | #347 | Tragic 2.2% |