Albanian vs Immigrants from Sierra Leone Professional Degree
COMPARE
Albanian
Immigrants from Sierra Leone
Professional Degree
Professional Degree Comparison
Albanians
Immigrants from Sierra Leone
4.9%
PROFESSIONAL DEGREE
95.3/ 100
METRIC RATING
120th/ 347
METRIC RANK
4.5%
PROFESSIONAL DEGREE
58.7/ 100
METRIC RATING
168th/ 347
METRIC RANK
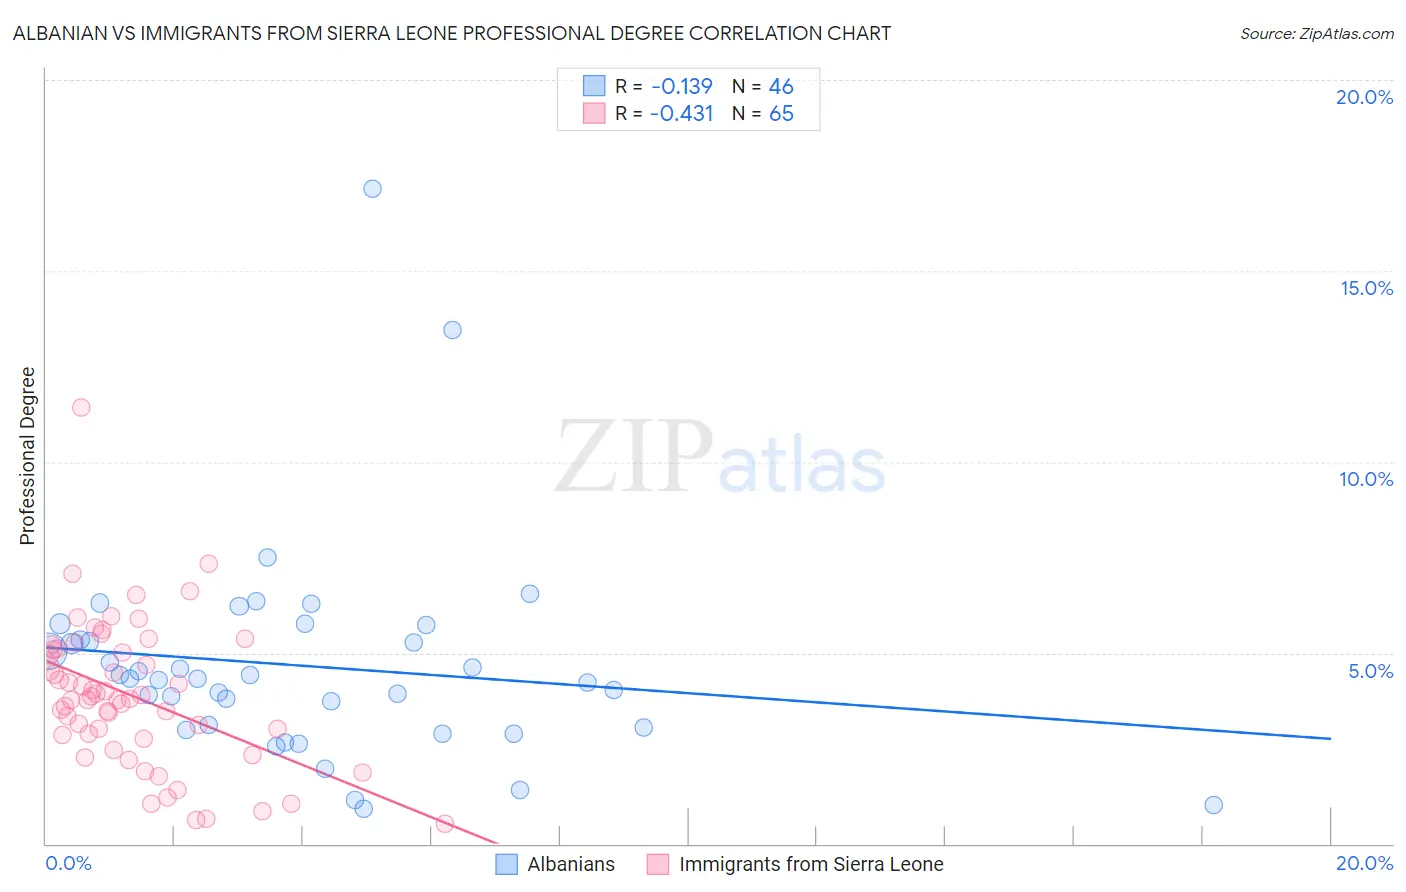
Albanian vs Immigrants from Sierra Leone Professional Degree Correlation Chart
The statistical analysis conducted on geographies consisting of 193,107,529 people shows a poor negative correlation between the proportion of Albanians and percentage of population with at least professional degree education in the United States with a correlation coefficient (R) of -0.139 and weighted average of 4.9%. Similarly, the statistical analysis conducted on geographies consisting of 101,572,134 people shows a moderate negative correlation between the proportion of Immigrants from Sierra Leone and percentage of population with at least professional degree education in the United States with a correlation coefficient (R) of -0.431 and weighted average of 4.5%, a difference of 9.6%.
Professional Degree Correlation Summary
| Measurement | Albanian | Immigrants from Sierra Leone |
| Minimum | 0.91% | 0.52% |
| Maximum | 17.1% | 11.4% |
| Range | 16.2% | 10.9% |
| Mean | 4.7% | 3.9% |
| Median | 4.3% | 3.8% |
| Interquartile 25% (IQ1) | 3.0% | 2.8% |
| Interquartile 75% (IQ3) | 5.3% | 5.1% |
| Interquartile Range (IQR) | 2.3% | 2.3% |
| Standard Deviation (Sample) | 2.8% | 1.9% |
| Standard Deviation (Population) | 2.8% | 1.9% |
Similar Demographics by Professional Degree
Demographics Similar to Albanians by Professional Degree
In terms of professional degree, the demographic groups most similar to Albanians are Immigrants from Sudan (4.9%, a difference of 0.010%), Immigrants from Moldova (4.9%, a difference of 0.35%), Immigrants from Syria (4.9%, a difference of 0.55%), Croatian (4.9%, a difference of 0.55%), and Venezuelan (4.9%, a difference of 0.76%).
| Demographics | Rating | Rank | Professional Degree |
| Immigrants | Pakistan | 97.2 /100 | #113 | Exceptional 5.0% |
| Immigrants | Morocco | 96.8 /100 | #114 | Exceptional 5.0% |
| Moroccans | 96.8 /100 | #115 | Exceptional 5.0% |
| Venezuelans | 96.3 /100 | #116 | Exceptional 4.9% |
| Immigrants | Syria | 96.0 /100 | #117 | Exceptional 4.9% |
| Croatians | 96.0 /100 | #118 | Exceptional 4.9% |
| Immigrants | Sudan | 95.4 /100 | #119 | Exceptional 4.9% |
| Albanians | 95.3 /100 | #120 | Exceptional 4.9% |
| Immigrants | Moldova | 94.8 /100 | #121 | Exceptional 4.9% |
| Immigrants | Germany | 94.1 /100 | #122 | Exceptional 4.9% |
| Immigrants | Venezuela | 93.8 /100 | #123 | Exceptional 4.8% |
| Immigrants | Eritrea | 93.5 /100 | #124 | Exceptional 4.8% |
| Immigrants | Albania | 93.3 /100 | #125 | Exceptional 4.8% |
| Europeans | 93.2 /100 | #126 | Exceptional 4.8% |
| Serbians | 92.6 /100 | #127 | Exceptional 4.8% |
Demographics Similar to Immigrants from Sierra Leone by Professional Degree
In terms of professional degree, the demographic groups most similar to Immigrants from Sierra Leone are Chinese (4.5%, a difference of 0.020%), Immigrants from Afghanistan (4.5%, a difference of 0.070%), Immigrants from Colombia (4.5%, a difference of 0.10%), Costa Rican (4.5%, a difference of 0.17%), and Immigrants from Zaire (4.5%, a difference of 0.19%).
| Demographics | Rating | Rank | Professional Degree |
| Assyrians/Chaldeans/Syriacs | 67.4 /100 | #161 | Good 4.5% |
| Peruvians | 65.2 /100 | #162 | Good 4.5% |
| Sierra Leoneans | 64.3 /100 | #163 | Good 4.5% |
| Swiss | 61.0 /100 | #164 | Good 4.5% |
| Costa Ricans | 59.9 /100 | #165 | Average 4.5% |
| Immigrants | Colombia | 59.4 /100 | #166 | Average 4.5% |
| Immigrants | Afghanistan | 59.2 /100 | #167 | Average 4.5% |
| Immigrants | Sierra Leone | 58.7 /100 | #168 | Average 4.5% |
| Chinese | 58.6 /100 | #169 | Average 4.5% |
| Immigrants | Zaire | 57.4 /100 | #170 | Average 4.5% |
| Immigrants | Bangladesh | 56.0 /100 | #171 | Average 4.4% |
| Spaniards | 52.0 /100 | #172 | Average 4.4% |
| English | 50.1 /100 | #173 | Average 4.4% |
| Kenyans | 50.0 /100 | #174 | Average 4.4% |
| Irish | 50.0 /100 | #175 | Average 4.4% |