Albanian vs Slavic Professional Degree
COMPARE
Albanian
Slavic
Professional Degree
Professional Degree Comparison
Albanians
Slavs
4.9%
PROFESSIONAL DEGREE
95.3/ 100
METRIC RATING
120th/ 347
METRIC RANK
4.5%
PROFESSIONAL DEGREE
70.8/ 100
METRIC RATING
155th/ 347
METRIC RANK
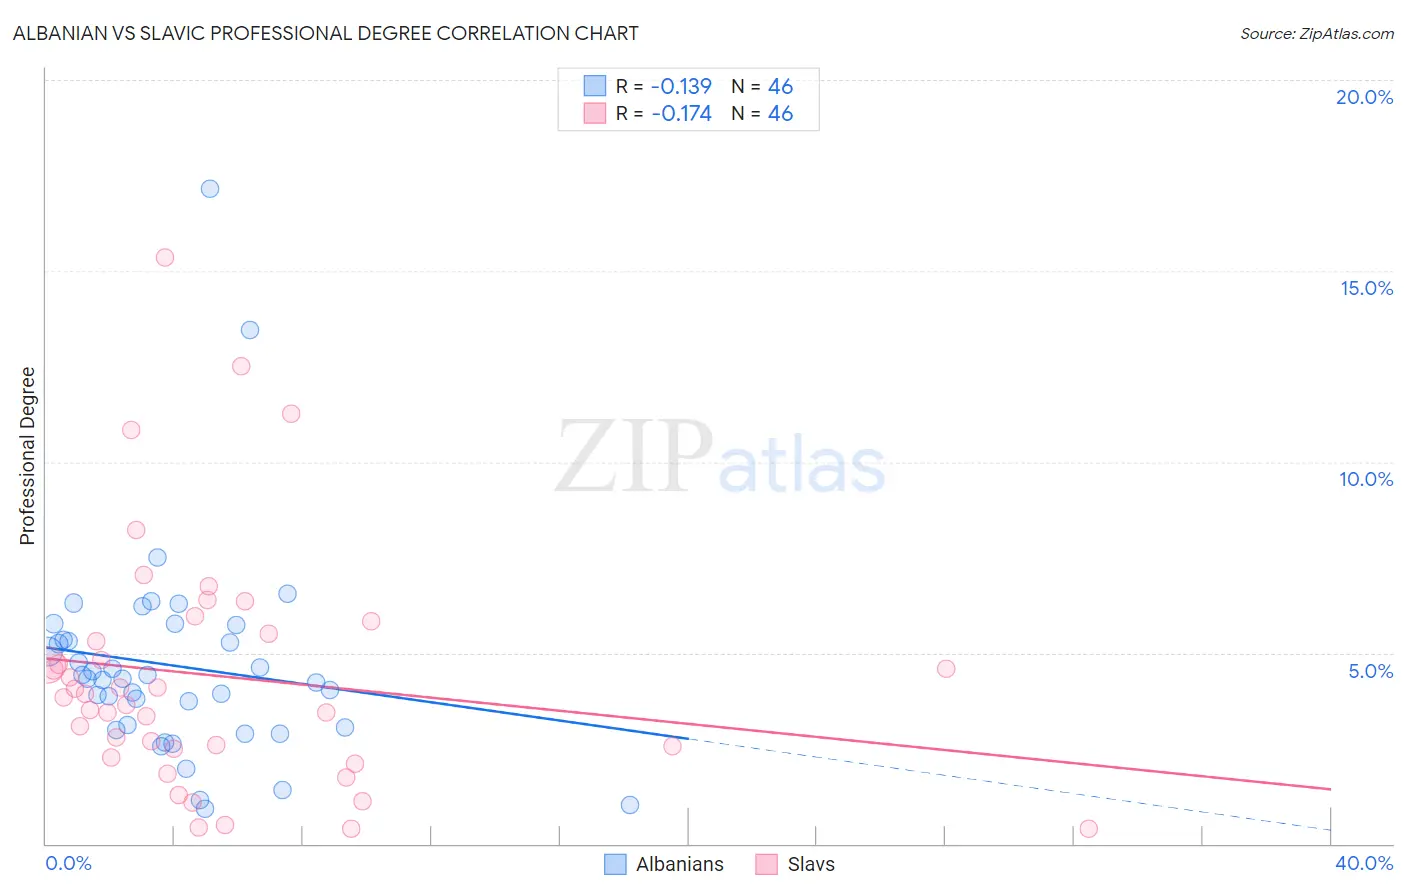
Albanian vs Slavic Professional Degree Correlation Chart
The statistical analysis conducted on geographies consisting of 193,107,529 people shows a poor negative correlation between the proportion of Albanians and percentage of population with at least professional degree education in the United States with a correlation coefficient (R) of -0.139 and weighted average of 4.9%. Similarly, the statistical analysis conducted on geographies consisting of 270,501,268 people shows a poor negative correlation between the proportion of Slavs and percentage of population with at least professional degree education in the United States with a correlation coefficient (R) of -0.174 and weighted average of 4.5%, a difference of 7.5%.
Professional Degree Correlation Summary
| Measurement | Albanian | Slavic |
| Minimum | 0.91% | 0.39% |
| Maximum | 17.1% | 15.4% |
| Range | 16.2% | 15.0% |
| Mean | 4.7% | 4.4% |
| Median | 4.3% | 3.9% |
| Interquartile 25% (IQ1) | 3.0% | 2.5% |
| Interquartile 75% (IQ3) | 5.3% | 5.5% |
| Interquartile Range (IQR) | 2.3% | 3.0% |
| Standard Deviation (Sample) | 2.8% | 3.2% |
| Standard Deviation (Population) | 2.8% | 3.2% |
Similar Demographics by Professional Degree
Demographics Similar to Albanians by Professional Degree
In terms of professional degree, the demographic groups most similar to Albanians are Immigrants from Sudan (4.9%, a difference of 0.010%), Immigrants from Moldova (4.9%, a difference of 0.35%), Immigrants from Syria (4.9%, a difference of 0.55%), Croatian (4.9%, a difference of 0.55%), and Venezuelan (4.9%, a difference of 0.76%).
| Demographics | Rating | Rank | Professional Degree |
| Immigrants | Pakistan | 97.2 /100 | #113 | Exceptional 5.0% |
| Immigrants | Morocco | 96.8 /100 | #114 | Exceptional 5.0% |
| Moroccans | 96.8 /100 | #115 | Exceptional 5.0% |
| Venezuelans | 96.3 /100 | #116 | Exceptional 4.9% |
| Immigrants | Syria | 96.0 /100 | #117 | Exceptional 4.9% |
| Croatians | 96.0 /100 | #118 | Exceptional 4.9% |
| Immigrants | Sudan | 95.4 /100 | #119 | Exceptional 4.9% |
| Albanians | 95.3 /100 | #120 | Exceptional 4.9% |
| Immigrants | Moldova | 94.8 /100 | #121 | Exceptional 4.9% |
| Immigrants | Germany | 94.1 /100 | #122 | Exceptional 4.9% |
| Immigrants | Venezuela | 93.8 /100 | #123 | Exceptional 4.8% |
| Immigrants | Eritrea | 93.5 /100 | #124 | Exceptional 4.8% |
| Immigrants | Albania | 93.3 /100 | #125 | Exceptional 4.8% |
| Europeans | 93.2 /100 | #126 | Exceptional 4.8% |
| Serbians | 92.6 /100 | #127 | Exceptional 4.8% |
Demographics Similar to Slavs by Professional Degree
In terms of professional degree, the demographic groups most similar to Slavs are Swedish (4.5%, a difference of 0.15%), Iraqi (4.5%, a difference of 0.16%), Scottish (4.6%, a difference of 0.18%), Immigrants from Africa (4.6%, a difference of 0.30%), and Immigrants from Uruguay (4.6%, a difference of 0.30%).
| Demographics | Rating | Rank | Professional Degree |
| Slovenes | 76.1 /100 | #148 | Good 4.6% |
| Senegalese | 75.3 /100 | #149 | Good 4.6% |
| Immigrants | Oceania | 73.4 /100 | #150 | Good 4.6% |
| Poles | 72.6 /100 | #151 | Good 4.6% |
| Immigrants | Africa | 72.5 /100 | #152 | Good 4.6% |
| Immigrants | Uruguay | 72.5 /100 | #153 | Good 4.6% |
| Scottish | 71.8 /100 | #154 | Good 4.6% |
| Slavs | 70.8 /100 | #155 | Good 4.5% |
| Swedes | 69.9 /100 | #156 | Good 4.5% |
| Iraqis | 69.8 /100 | #157 | Good 4.5% |
| Immigrants | Armenia | 68.8 /100 | #158 | Good 4.5% |
| Vietnamese | 68.4 /100 | #159 | Good 4.5% |
| Immigrants | Senegal | 68.0 /100 | #160 | Good 4.5% |
| Assyrians/Chaldeans/Syriacs | 67.4 /100 | #161 | Good 4.5% |
| Peruvians | 65.2 /100 | #162 | Good 4.5% |