Albanian vs Immigrants from Congo Per Capita Income
COMPARE
Albanian
Immigrants from Congo
Per Capita Income
Per Capita Income Comparison
Albanians
Immigrants from Congo
$47,379
PER CAPITA INCOME
98.5/ 100
METRIC RATING
94th/ 347
METRIC RANK
$35,720
PER CAPITA INCOME
0.0/ 100
METRIC RATING
319th/ 347
METRIC RANK
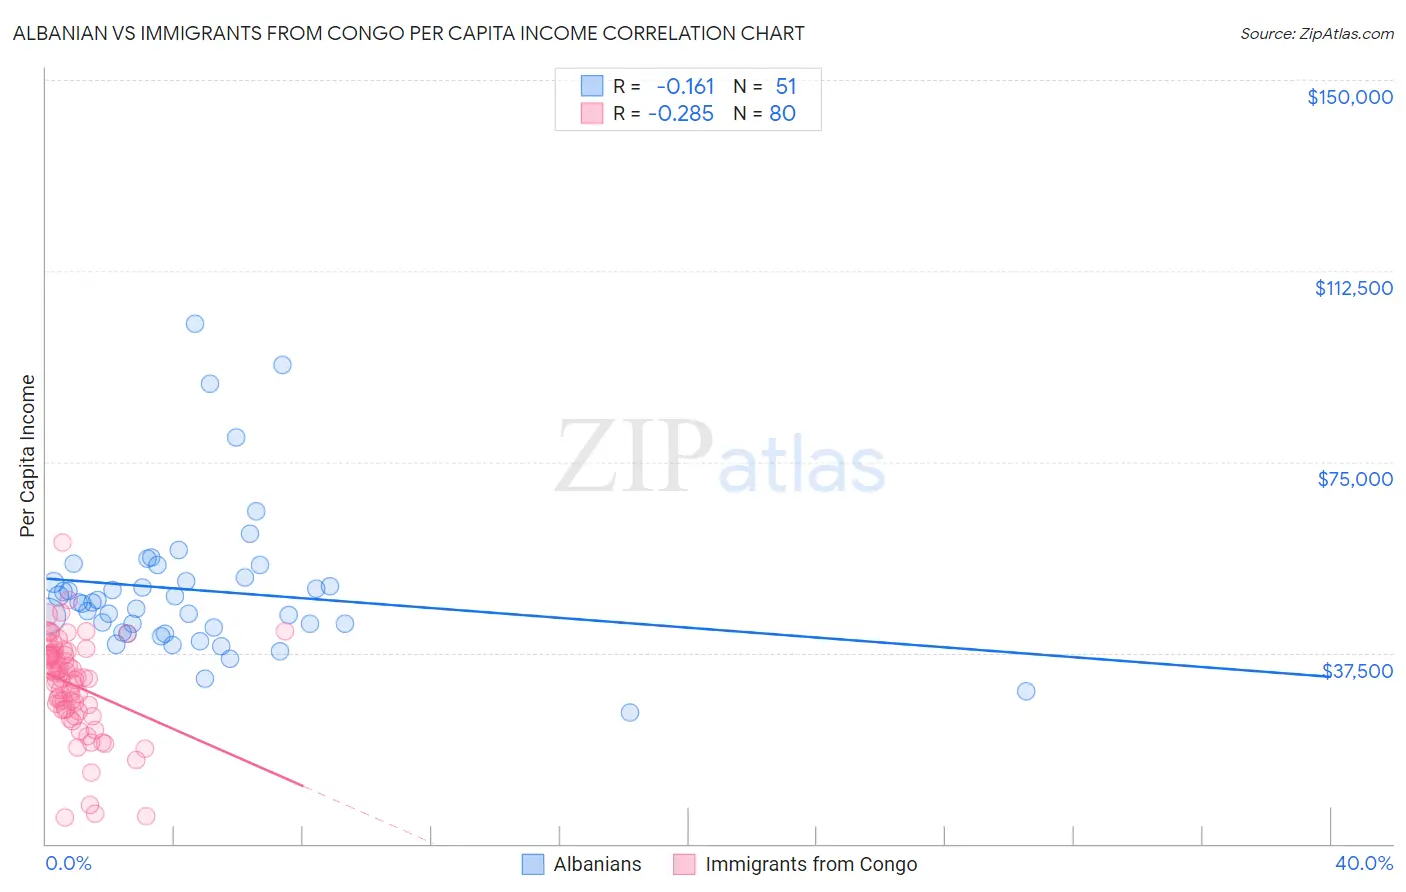
Albanian vs Immigrants from Congo Per Capita Income Correlation Chart
The statistical analysis conducted on geographies consisting of 193,264,500 people shows a poor negative correlation between the proportion of Albanians and per capita income in the United States with a correlation coefficient (R) of -0.161 and weighted average of $47,379. Similarly, the statistical analysis conducted on geographies consisting of 92,126,617 people shows a weak negative correlation between the proportion of Immigrants from Congo and per capita income in the United States with a correlation coefficient (R) of -0.285 and weighted average of $35,720, a difference of 32.6%.
Per Capita Income Correlation Summary
| Measurement | Albanian | Immigrants from Congo |
| Minimum | $25,698 | $5,075 |
| Maximum | $102,102 | $59,125 |
| Range | $76,404 | $54,050 |
| Mean | $49,796 | $31,172 |
| Median | $47,330 | $32,475 |
| Interquartile 25% (IQ1) | $41,568 | $26,293 |
| Interquartile 75% (IQ3) | $52,221 | $37,243 |
| Interquartile Range (IQR) | $10,654 | $10,950 |
| Standard Deviation (Sample) | $14,520 | $9,699 |
| Standard Deviation (Population) | $14,376 | $9,639 |
Similar Demographics by Per Capita Income
Demographics Similar to Albanians by Per Capita Income
In terms of per capita income, the demographic groups most similar to Albanians are Immigrants from Zimbabwe ($47,394, a difference of 0.030%), Immigrants from Egypt ($47,361, a difference of 0.040%), Alsatian ($47,284, a difference of 0.20%), Immigrants from Moldova ($47,489, a difference of 0.23%), and Carpatho Rusyn ($47,248, a difference of 0.28%).
| Demographics | Rating | Rank | Per Capita Income |
| Ukrainians | 99.3 /100 | #87 | Exceptional $48,014 |
| Croatians | 99.0 /100 | #88 | Exceptional $47,742 |
| Northern Europeans | 98.9 /100 | #89 | Exceptional $47,698 |
| Italians | 98.8 /100 | #90 | Exceptional $47,574 |
| Macedonians | 98.8 /100 | #91 | Exceptional $47,573 |
| Immigrants | Moldova | 98.7 /100 | #92 | Exceptional $47,489 |
| Immigrants | Zimbabwe | 98.5 /100 | #93 | Exceptional $47,394 |
| Albanians | 98.5 /100 | #94 | Exceptional $47,379 |
| Immigrants | Egypt | 98.5 /100 | #95 | Exceptional $47,361 |
| Alsatians | 98.3 /100 | #96 | Exceptional $47,284 |
| Carpatho Rusyns | 98.2 /100 | #97 | Exceptional $47,248 |
| Immigrants | Pakistan | 97.9 /100 | #98 | Exceptional $47,084 |
| Laotians | 97.8 /100 | #99 | Exceptional $47,041 |
| Immigrants | Lebanon | 97.5 /100 | #100 | Exceptional $46,938 |
| Immigrants | Uzbekistan | 97.5 /100 | #101 | Exceptional $46,929 |
Demographics Similar to Immigrants from Congo by Per Capita Income
In terms of per capita income, the demographic groups most similar to Immigrants from Congo are Hispanic or Latino ($35,688, a difference of 0.090%), Black/African American ($35,564, a difference of 0.44%), Creek ($35,546, a difference of 0.49%), Bangladeshi ($35,897, a difference of 0.50%), and Dutch West Indian ($35,922, a difference of 0.57%).
| Demographics | Rating | Rank | Per Capita Income |
| Chickasaw | 0.0 /100 | #312 | Tragic $36,475 |
| Bahamians | 0.0 /100 | #313 | Tragic $36,427 |
| Seminole | 0.0 /100 | #314 | Tragic $36,180 |
| Yaqui | 0.0 /100 | #315 | Tragic $36,112 |
| Choctaw | 0.0 /100 | #316 | Tragic $35,999 |
| Dutch West Indians | 0.0 /100 | #317 | Tragic $35,922 |
| Bangladeshis | 0.0 /100 | #318 | Tragic $35,897 |
| Immigrants | Congo | 0.0 /100 | #319 | Tragic $35,720 |
| Hispanics or Latinos | 0.0 /100 | #320 | Tragic $35,688 |
| Blacks/African Americans | 0.0 /100 | #321 | Tragic $35,564 |
| Creek | 0.0 /100 | #322 | Tragic $35,546 |
| Cheyenne | 0.0 /100 | #323 | Tragic $35,276 |
| Kiowa | 0.0 /100 | #324 | Tragic $35,102 |
| Immigrants | Central America | 0.0 /100 | #325 | Tragic $34,974 |
| Immigrants | Cuba | 0.0 /100 | #326 | Tragic $34,910 |