Albanian vs Immigrants from Congo Currently Married
COMPARE
Albanian
Immigrants from Congo
Currently Married
Currently Married Comparison
Albanians
Immigrants from Congo
47.0%
CURRENTLY MARRIED
68.6/ 100
METRIC RATING
154th/ 347
METRIC RANK
41.1%
CURRENTLY MARRIED
0.0/ 100
METRIC RATING
321st/ 347
METRIC RANK
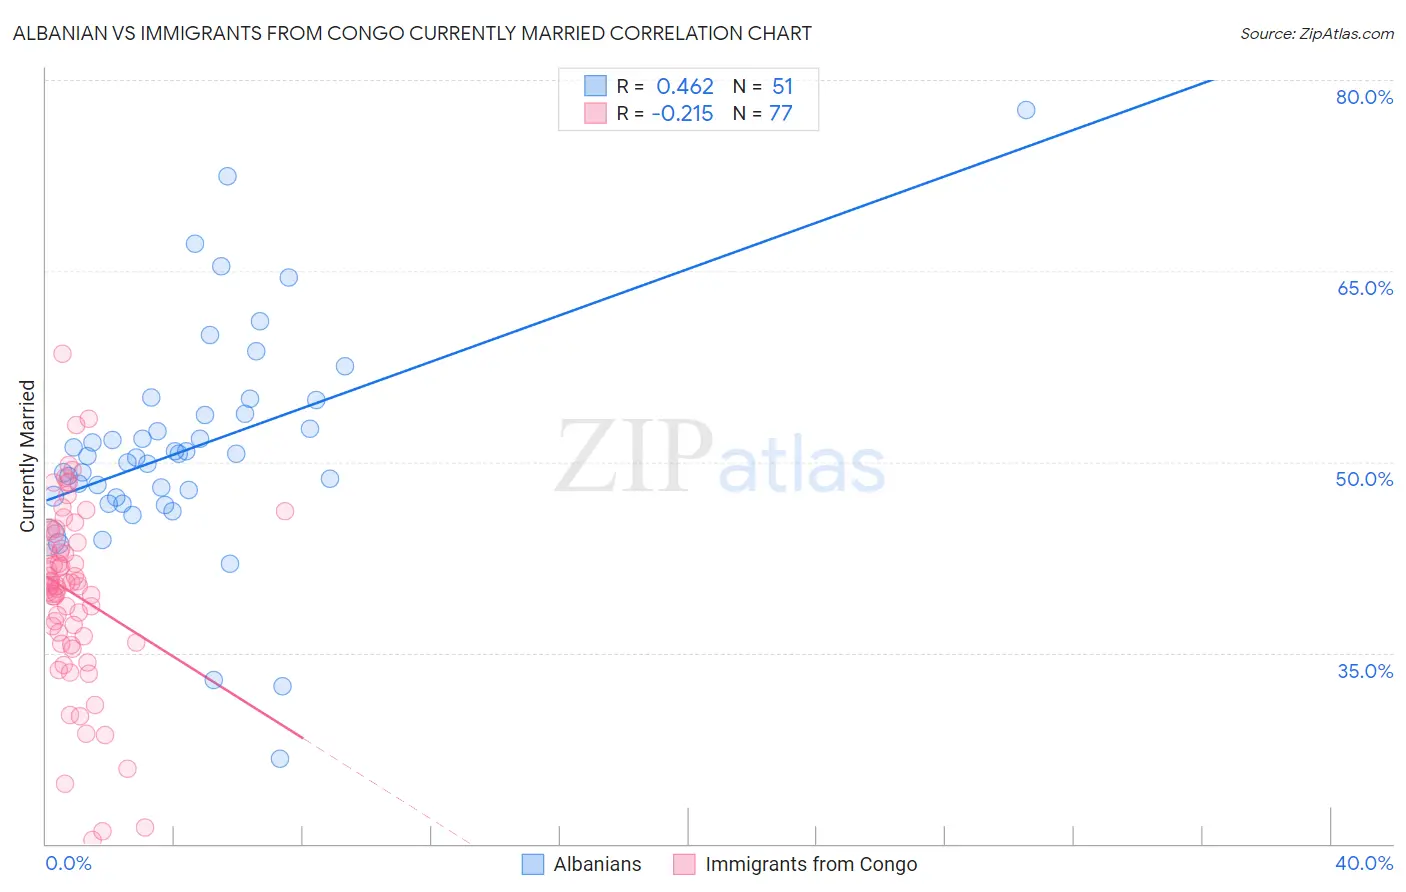
Albanian vs Immigrants from Congo Currently Married Correlation Chart
The statistical analysis conducted on geographies consisting of 193,235,745 people shows a moderate positive correlation between the proportion of Albanians and percentage of population currently married in the United States with a correlation coefficient (R) of 0.462 and weighted average of 47.0%. Similarly, the statistical analysis conducted on geographies consisting of 92,127,634 people shows a weak negative correlation between the proportion of Immigrants from Congo and percentage of population currently married in the United States with a correlation coefficient (R) of -0.215 and weighted average of 41.1%, a difference of 14.4%.
Currently Married Correlation Summary
| Measurement | Albanian | Immigrants from Congo |
| Minimum | 26.7% | 20.3% |
| Maximum | 77.6% | 58.5% |
| Range | 50.9% | 38.2% |
| Mean | 51.0% | 39.7% |
| Median | 50.5% | 40.3% |
| Interquartile 25% (IQ1) | 47.2% | 36.0% |
| Interquartile 75% (IQ3) | 53.7% | 44.0% |
| Interquartile Range (IQR) | 6.5% | 8.0% |
| Standard Deviation (Sample) | 8.8% | 7.2% |
| Standard Deviation (Population) | 8.7% | 7.2% |
Similar Demographics by Currently Married
Demographics Similar to Albanians by Currently Married
In terms of currently married, the demographic groups most similar to Albanians are Immigrants from Venezuela (47.0%, a difference of 0.0%), Arab (47.0%, a difference of 0.0%), Immigrants from Serbia (47.0%, a difference of 0.010%), Spanish (47.0%, a difference of 0.020%), and Immigrants from Switzerland (46.9%, a difference of 0.030%).
| Demographics | Rating | Rank | Currently Married |
| Immigrants | Argentina | 72.0 /100 | #147 | Good 47.0% |
| Cambodians | 70.4 /100 | #148 | Good 47.0% |
| Zimbabweans | 70.1 /100 | #149 | Good 47.0% |
| Immigrants | Turkey | 70.0 /100 | #150 | Good 47.0% |
| Chileans | 69.8 /100 | #151 | Good 47.0% |
| Immigrants | Serbia | 68.8 /100 | #152 | Good 47.0% |
| Immigrants | Venezuela | 68.6 /100 | #153 | Good 47.0% |
| Albanians | 68.6 /100 | #154 | Good 47.0% |
| Arabs | 68.6 /100 | #155 | Good 47.0% |
| Spanish | 68.1 /100 | #156 | Good 47.0% |
| Immigrants | Switzerland | 67.8 /100 | #157 | Good 46.9% |
| Cherokee | 66.8 /100 | #158 | Good 46.9% |
| Iraqis | 66.4 /100 | #159 | Good 46.9% |
| Immigrants | Uzbekistan | 66.0 /100 | #160 | Good 46.9% |
| Immigrants | Southern Europe | 65.9 /100 | #161 | Good 46.9% |
Demographics Similar to Immigrants from Congo by Currently Married
In terms of currently married, the demographic groups most similar to Immigrants from Congo are Immigrants from Haiti (41.0%, a difference of 0.13%), Immigrants from Jamaica (41.1%, a difference of 0.23%), Immigrants from Somalia (41.2%, a difference of 0.29%), Bahamian (41.2%, a difference of 0.31%), and Haitian (41.3%, a difference of 0.49%).
| Demographics | Rating | Rank | Currently Married |
| West Indians | 0.0 /100 | #314 | Tragic 41.3% |
| Inupiat | 0.0 /100 | #315 | Tragic 41.3% |
| Immigrants | Caribbean | 0.0 /100 | #316 | Tragic 41.3% |
| Haitians | 0.0 /100 | #317 | Tragic 41.3% |
| Bahamians | 0.0 /100 | #318 | Tragic 41.2% |
| Immigrants | Somalia | 0.0 /100 | #319 | Tragic 41.2% |
| Immigrants | Jamaica | 0.0 /100 | #320 | Tragic 41.1% |
| Immigrants | Congo | 0.0 /100 | #321 | Tragic 41.1% |
| Immigrants | Haiti | 0.0 /100 | #322 | Tragic 41.0% |
| Immigrants | West Indies | 0.0 /100 | #323 | Tragic 40.7% |
| Immigrants | Senegal | 0.0 /100 | #324 | Tragic 40.7% |
| U.S. Virgin Islanders | 0.0 /100 | #325 | Tragic 40.7% |
| Barbadians | 0.0 /100 | #326 | Tragic 40.6% |
| Senegalese | 0.0 /100 | #327 | Tragic 40.6% |
| Arapaho | 0.0 /100 | #328 | Tragic 40.5% |