Burmese vs Immigrants from Congo Professional Degree
COMPARE
Burmese
Immigrants from Congo
Professional Degree
Professional Degree Comparison
Burmese
Immigrants from Congo
6.1%
PROFESSIONAL DEGREE
100.0/ 100
METRIC RATING
33rd/ 347
METRIC RANK
3.6%
PROFESSIONAL DEGREE
0.8/ 100
METRIC RATING
265th/ 347
METRIC RANK
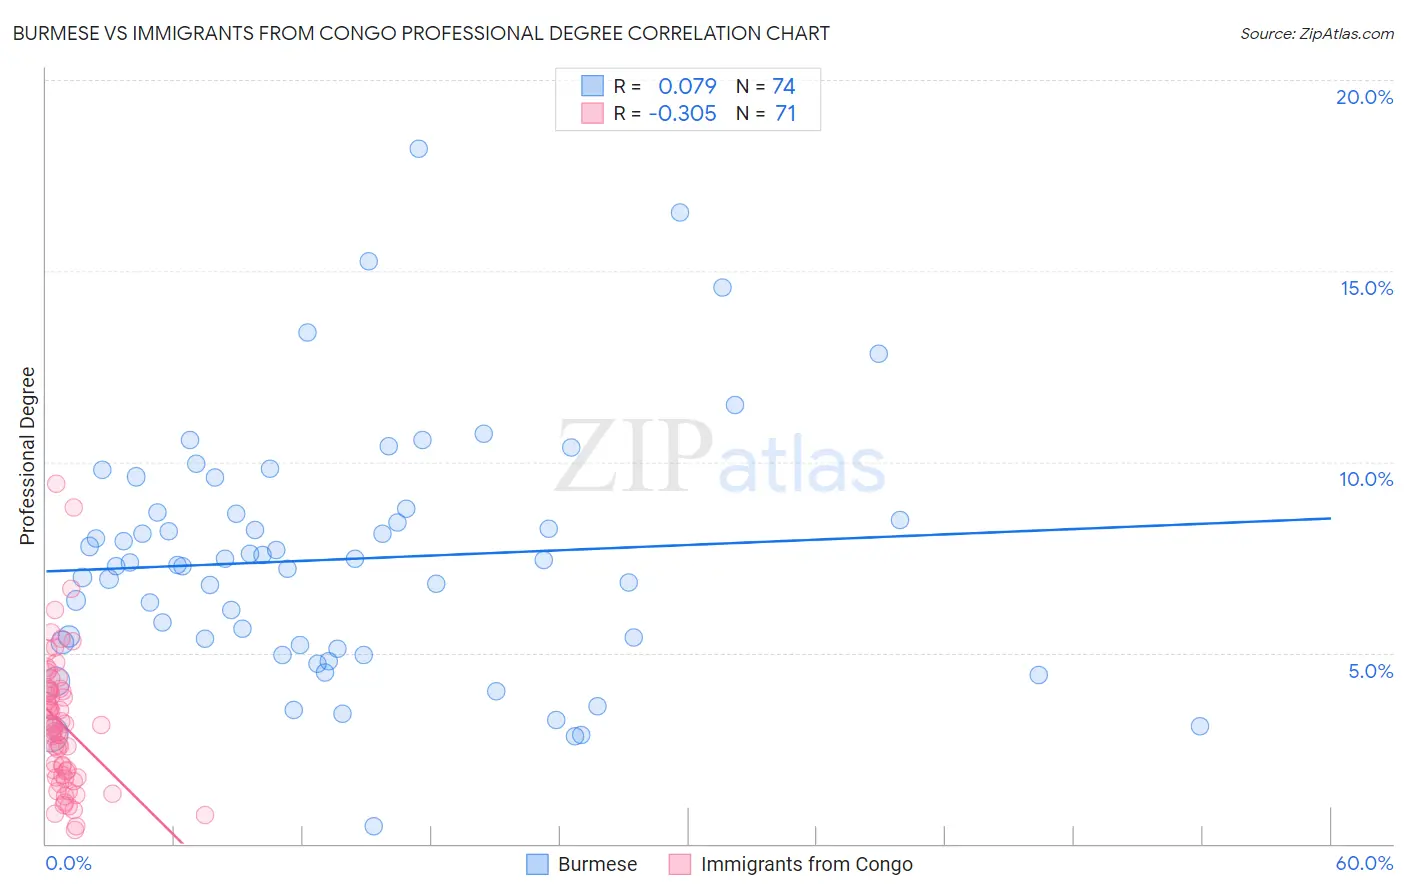
Burmese vs Immigrants from Congo Professional Degree Correlation Chart
The statistical analysis conducted on geographies consisting of 463,932,708 people shows a slight positive correlation between the proportion of Burmese and percentage of population with at least professional degree education in the United States with a correlation coefficient (R) of 0.079 and weighted average of 6.1%. Similarly, the statistical analysis conducted on geographies consisting of 92,025,437 people shows a mild negative correlation between the proportion of Immigrants from Congo and percentage of population with at least professional degree education in the United States with a correlation coefficient (R) of -0.305 and weighted average of 3.6%, a difference of 68.6%.
Professional Degree Correlation Summary
| Measurement | Burmese | Immigrants from Congo |
| Minimum | 0.47% | 0.35% |
| Maximum | 18.2% | 9.4% |
| Range | 17.7% | 9.1% |
| Mean | 7.5% | 3.1% |
| Median | 7.3% | 3.0% |
| Interquartile 25% (IQ1) | 5.2% | 1.7% |
| Interquartile 75% (IQ3) | 8.7% | 4.0% |
| Interquartile Range (IQR) | 3.5% | 2.3% |
| Standard Deviation (Sample) | 3.3% | 1.8% |
| Standard Deviation (Population) | 3.2% | 1.8% |
Similar Demographics by Professional Degree
Demographics Similar to Burmese by Professional Degree
In terms of professional degree, the demographic groups most similar to Burmese are Thai (6.1%, a difference of 0.030%), Mongolian (6.1%, a difference of 0.13%), Immigrants from India (6.2%, a difference of 0.27%), Immigrants from Sri Lanka (6.2%, a difference of 0.39%), and Immigrants from Turkey (6.2%, a difference of 0.39%).
| Demographics | Rating | Rank | Professional Degree |
| Latvians | 100.0 /100 | #26 | Exceptional 6.2% |
| Immigrants | Northern Europe | 100.0 /100 | #27 | Exceptional 6.2% |
| Turks | 100.0 /100 | #28 | Exceptional 6.2% |
| Immigrants | Sri Lanka | 100.0 /100 | #29 | Exceptional 6.2% |
| Immigrants | Turkey | 100.0 /100 | #30 | Exceptional 6.2% |
| Immigrants | India | 100.0 /100 | #31 | Exceptional 6.2% |
| Thais | 100.0 /100 | #32 | Exceptional 6.1% |
| Burmese | 100.0 /100 | #33 | Exceptional 6.1% |
| Mongolians | 100.0 /100 | #34 | Exceptional 6.1% |
| Immigrants | Korea | 100.0 /100 | #35 | Exceptional 6.1% |
| Immigrants | Russia | 100.0 /100 | #36 | Exceptional 6.0% |
| Immigrants | Austria | 100.0 /100 | #37 | Exceptional 6.0% |
| Immigrants | Norway | 100.0 /100 | #38 | Exceptional 6.0% |
| Immigrants | South Africa | 100.0 /100 | #39 | Exceptional 6.0% |
| Cambodians | 100.0 /100 | #40 | Exceptional 6.0% |
Demographics Similar to Immigrants from Congo by Professional Degree
In terms of professional degree, the demographic groups most similar to Immigrants from Congo are Immigrants from Cambodia (3.6%, a difference of 0.040%), Hopi (3.6%, a difference of 0.060%), Central American Indian (3.6%, a difference of 0.32%), U.S. Virgin Islander (3.7%, a difference of 0.56%), and Immigrants from Guyana (3.7%, a difference of 0.57%).
| Demographics | Rating | Rank | Professional Degree |
| Immigrants | St. Vincent and the Grenadines | 1.1 /100 | #258 | Tragic 3.7% |
| Africans | 1.0 /100 | #259 | Tragic 3.7% |
| Indonesians | 1.0 /100 | #260 | Tragic 3.7% |
| Immigrants | Guyana | 1.0 /100 | #261 | Tragic 3.7% |
| U.S. Virgin Islanders | 1.0 /100 | #262 | Tragic 3.7% |
| Hopi | 0.9 /100 | #263 | Tragic 3.6% |
| Immigrants | Cambodia | 0.9 /100 | #264 | Tragic 3.6% |
| Immigrants | Congo | 0.8 /100 | #265 | Tragic 3.6% |
| Central American Indians | 0.8 /100 | #266 | Tragic 3.6% |
| Delaware | 0.7 /100 | #267 | Tragic 3.6% |
| Aleuts | 0.7 /100 | #268 | Tragic 3.6% |
| Immigrants | Cuba | 0.6 /100 | #269 | Tragic 3.6% |
| Central Americans | 0.6 /100 | #270 | Tragic 3.6% |
| Belizeans | 0.5 /100 | #271 | Tragic 3.6% |
| Immigrants | Jamaica | 0.5 /100 | #272 | Tragic 3.6% |