Afghan vs Immigrants from Congo Professional Degree
COMPARE
Afghan
Immigrants from Congo
Professional Degree
Professional Degree Comparison
Afghans
Immigrants from Congo
4.7%
PROFESSIONAL DEGREE
88.8/ 100
METRIC RATING
138th/ 347
METRIC RANK
3.6%
PROFESSIONAL DEGREE
0.8/ 100
METRIC RATING
265th/ 347
METRIC RANK
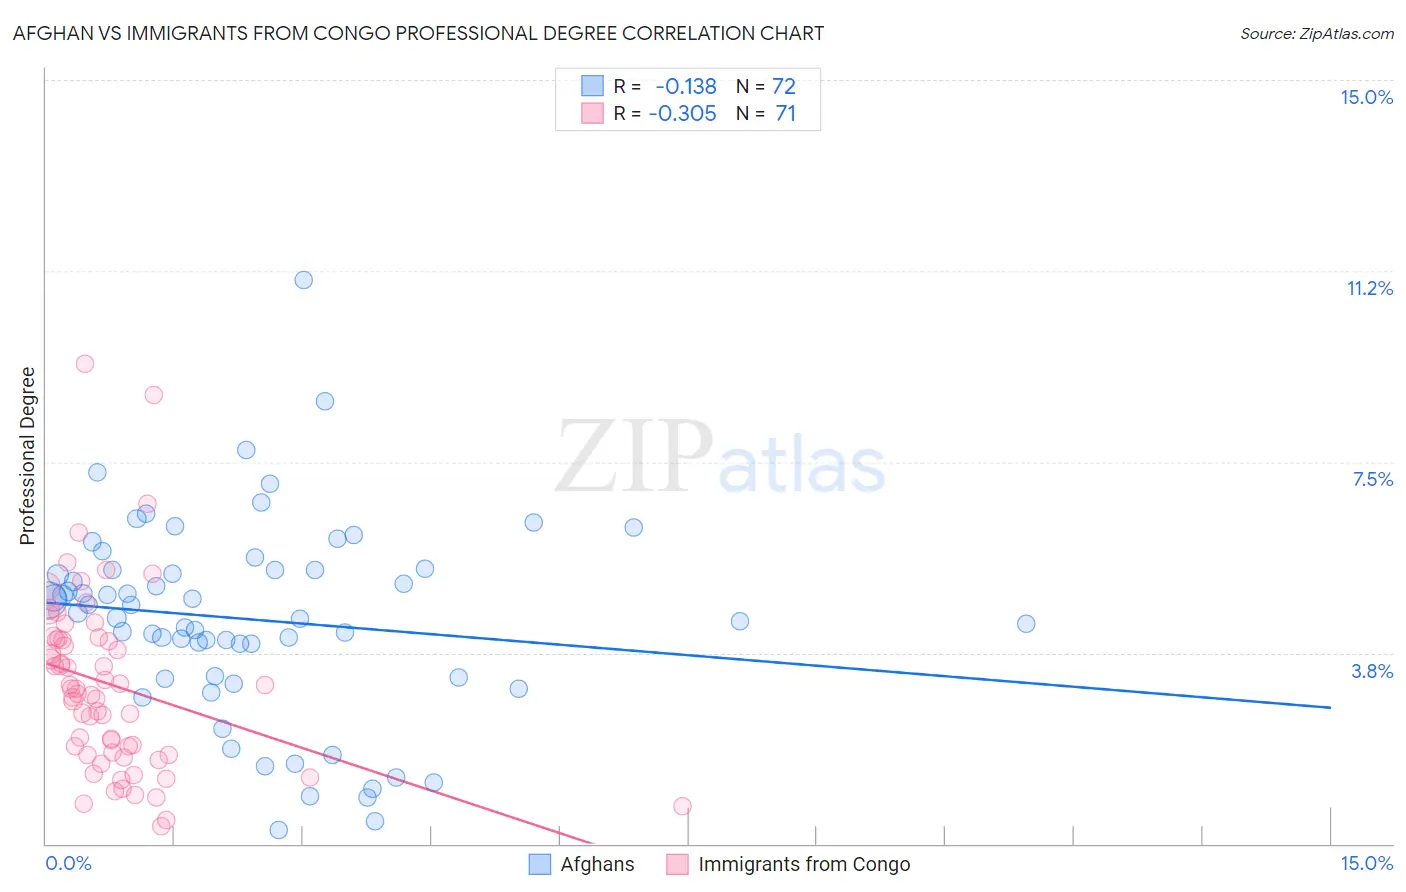
Afghan vs Immigrants from Congo Professional Degree Correlation Chart
The statistical analysis conducted on geographies consisting of 148,828,949 people shows a poor negative correlation between the proportion of Afghans and percentage of population with at least professional degree education in the United States with a correlation coefficient (R) of -0.138 and weighted average of 4.7%. Similarly, the statistical analysis conducted on geographies consisting of 92,025,437 people shows a mild negative correlation between the proportion of Immigrants from Congo and percentage of population with at least professional degree education in the United States with a correlation coefficient (R) of -0.305 and weighted average of 3.6%, a difference of 30.0%.
Professional Degree Correlation Summary
| Measurement | Afghan | Immigrants from Congo |
| Minimum | 0.26% | 0.35% |
| Maximum | 11.1% | 9.4% |
| Range | 10.8% | 9.1% |
| Mean | 4.4% | 3.1% |
| Median | 4.5% | 3.0% |
| Interquartile 25% (IQ1) | 3.3% | 1.7% |
| Interquartile 75% (IQ3) | 5.4% | 4.0% |
| Interquartile Range (IQR) | 2.1% | 2.3% |
| Standard Deviation (Sample) | 1.9% | 1.8% |
| Standard Deviation (Population) | 1.9% | 1.8% |
Similar Demographics by Professional Degree
Demographics Similar to Afghans by Professional Degree
In terms of professional degree, the demographic groups most similar to Afghans are Jordanian (4.7%, a difference of 0.040%), Immigrants from Jordan (4.7%, a difference of 0.060%), Macedonian (4.8%, a difference of 0.34%), South American Indian (4.8%, a difference of 0.38%), and Italian (4.8%, a difference of 0.50%).
| Demographics | Rating | Rank | Professional Degree |
| Immigrants | Nepal | 91.4 /100 | #131 | Exceptional 4.8% |
| Pakistanis | 90.9 /100 | #132 | Exceptional 4.8% |
| Italians | 90.2 /100 | #133 | Exceptional 4.8% |
| South American Indians | 89.9 /100 | #134 | Excellent 4.8% |
| Macedonians | 89.8 /100 | #135 | Excellent 4.8% |
| Immigrants | Jordan | 89.0 /100 | #136 | Excellent 4.7% |
| Jordanians | 88.9 /100 | #137 | Excellent 4.7% |
| Afghans | 88.8 /100 | #138 | Excellent 4.7% |
| South Americans | 85.6 /100 | #139 | Excellent 4.7% |
| Canadians | 84.4 /100 | #140 | Excellent 4.7% |
| Basques | 81.8 /100 | #141 | Excellent 4.6% |
| Sudanese | 81.3 /100 | #142 | Excellent 4.6% |
| Hungarians | 80.8 /100 | #143 | Excellent 4.6% |
| Immigrants | South America | 80.5 /100 | #144 | Excellent 4.6% |
| Uruguayans | 80.2 /100 | #145 | Excellent 4.6% |
Demographics Similar to Immigrants from Congo by Professional Degree
In terms of professional degree, the demographic groups most similar to Immigrants from Congo are Immigrants from Cambodia (3.6%, a difference of 0.040%), Hopi (3.6%, a difference of 0.060%), Central American Indian (3.6%, a difference of 0.32%), U.S. Virgin Islander (3.7%, a difference of 0.56%), and Immigrants from Guyana (3.7%, a difference of 0.57%).
| Demographics | Rating | Rank | Professional Degree |
| Immigrants | St. Vincent and the Grenadines | 1.1 /100 | #258 | Tragic 3.7% |
| Africans | 1.0 /100 | #259 | Tragic 3.7% |
| Indonesians | 1.0 /100 | #260 | Tragic 3.7% |
| Immigrants | Guyana | 1.0 /100 | #261 | Tragic 3.7% |
| U.S. Virgin Islanders | 1.0 /100 | #262 | Tragic 3.7% |
| Hopi | 0.9 /100 | #263 | Tragic 3.6% |
| Immigrants | Cambodia | 0.9 /100 | #264 | Tragic 3.6% |
| Immigrants | Congo | 0.8 /100 | #265 | Tragic 3.6% |
| Central American Indians | 0.8 /100 | #266 | Tragic 3.6% |
| Delaware | 0.7 /100 | #267 | Tragic 3.6% |
| Aleuts | 0.7 /100 | #268 | Tragic 3.6% |
| Immigrants | Cuba | 0.6 /100 | #269 | Tragic 3.6% |
| Central Americans | 0.6 /100 | #270 | Tragic 3.6% |
| Belizeans | 0.5 /100 | #271 | Tragic 3.6% |
| Immigrants | Jamaica | 0.5 /100 | #272 | Tragic 3.6% |