Irish vs Immigrants from Congo Professional Degree
COMPARE
Irish
Immigrants from Congo
Professional Degree
Professional Degree Comparison
Irish
Immigrants from Congo
4.4%
PROFESSIONAL DEGREE
50.0/ 100
METRIC RATING
175th/ 347
METRIC RANK
3.6%
PROFESSIONAL DEGREE
0.8/ 100
METRIC RATING
265th/ 347
METRIC RANK
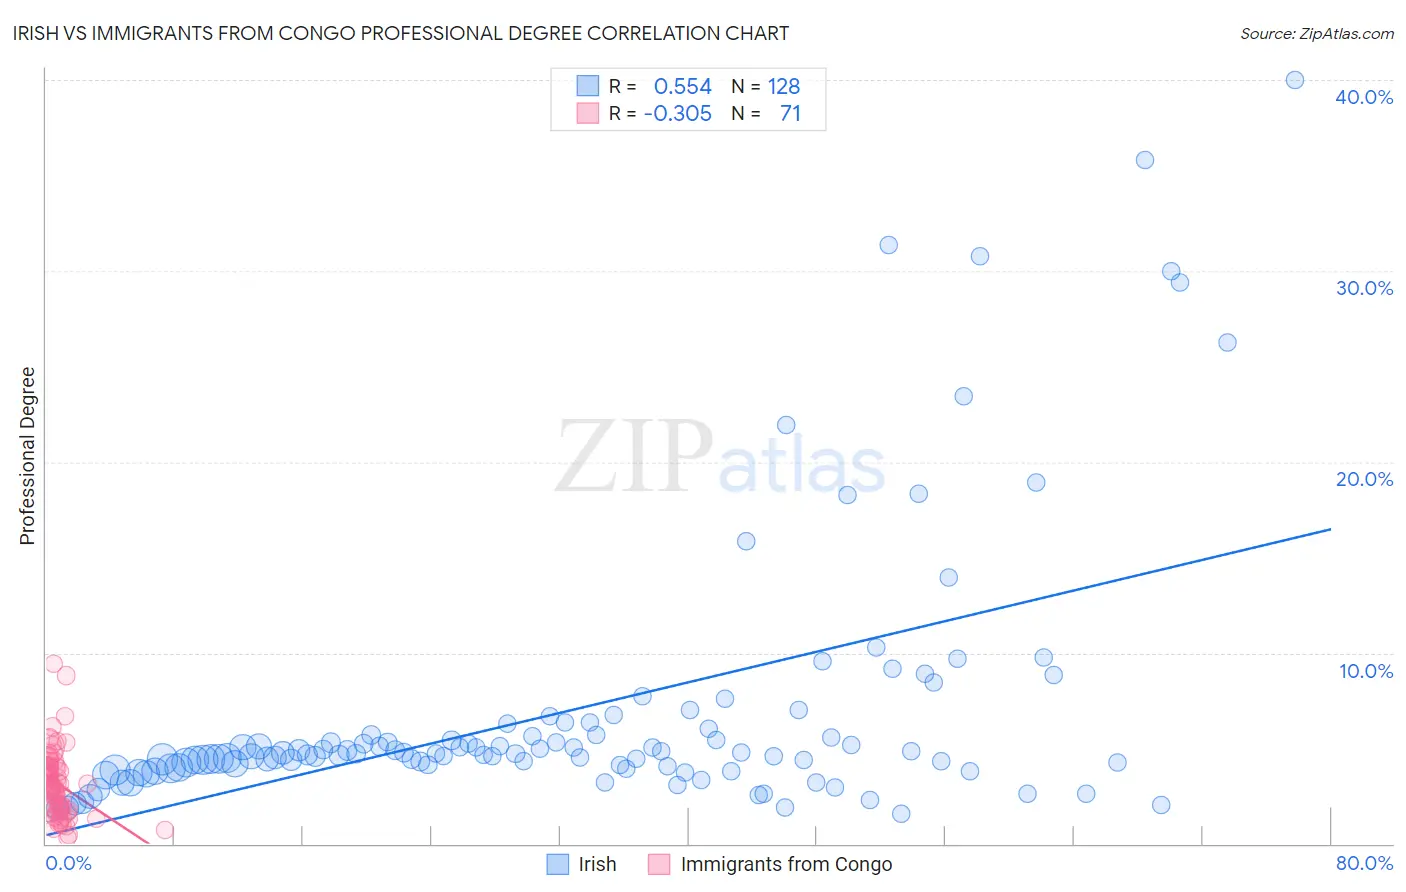
Irish vs Immigrants from Congo Professional Degree Correlation Chart
The statistical analysis conducted on geographies consisting of 569,237,980 people shows a substantial positive correlation between the proportion of Irish and percentage of population with at least professional degree education in the United States with a correlation coefficient (R) of 0.554 and weighted average of 4.4%. Similarly, the statistical analysis conducted on geographies consisting of 92,025,437 people shows a mild negative correlation between the proportion of Immigrants from Congo and percentage of population with at least professional degree education in the United States with a correlation coefficient (R) of -0.305 and weighted average of 3.6%, a difference of 20.9%.
Professional Degree Correlation Summary
| Measurement | Irish | Immigrants from Congo |
| Minimum | 1.5% | 0.35% |
| Maximum | 40.0% | 9.4% |
| Range | 38.5% | 9.1% |
| Mean | 7.0% | 3.1% |
| Median | 4.7% | 3.0% |
| Interquartile 25% (IQ1) | 4.0% | 1.7% |
| Interquartile 75% (IQ3) | 5.9% | 4.0% |
| Interquartile Range (IQR) | 1.9% | 2.3% |
| Standard Deviation (Sample) | 7.1% | 1.8% |
| Standard Deviation (Population) | 7.1% | 1.8% |
Similar Demographics by Professional Degree
Demographics Similar to Irish by Professional Degree
In terms of professional degree, the demographic groups most similar to Irish are Kenyan (4.4%, a difference of 0.0%), English (4.4%, a difference of 0.020%), Immigrants from Peru (4.4%, a difference of 0.10%), Spaniard (4.4%, a difference of 0.30%), and Celtic (4.4%, a difference of 0.35%).
| Demographics | Rating | Rank | Professional Degree |
| Immigrants | Sierra Leone | 58.7 /100 | #168 | Average 4.5% |
| Chinese | 58.6 /100 | #169 | Average 4.5% |
| Immigrants | Zaire | 57.4 /100 | #170 | Average 4.5% |
| Immigrants | Bangladesh | 56.0 /100 | #171 | Average 4.4% |
| Spaniards | 52.0 /100 | #172 | Average 4.4% |
| English | 50.1 /100 | #173 | Average 4.4% |
| Kenyans | 50.0 /100 | #174 | Average 4.4% |
| Irish | 50.0 /100 | #175 | Average 4.4% |
| Immigrants | Peru | 49.3 /100 | #176 | Average 4.4% |
| Celtics | 47.6 /100 | #177 | Average 4.4% |
| Immigrants | Costa Rica | 46.7 /100 | #178 | Average 4.4% |
| Immigrants | Kenya | 45.9 /100 | #179 | Average 4.4% |
| Czechs | 44.9 /100 | #180 | Average 4.4% |
| Danes | 43.5 /100 | #181 | Average 4.4% |
| Immigrants | Immigrants | 43.2 /100 | #182 | Average 4.4% |
Demographics Similar to Immigrants from Congo by Professional Degree
In terms of professional degree, the demographic groups most similar to Immigrants from Congo are Immigrants from Cambodia (3.6%, a difference of 0.040%), Hopi (3.6%, a difference of 0.060%), Central American Indian (3.6%, a difference of 0.32%), U.S. Virgin Islander (3.7%, a difference of 0.56%), and Immigrants from Guyana (3.7%, a difference of 0.57%).
| Demographics | Rating | Rank | Professional Degree |
| Immigrants | St. Vincent and the Grenadines | 1.1 /100 | #258 | Tragic 3.7% |
| Africans | 1.0 /100 | #259 | Tragic 3.7% |
| Indonesians | 1.0 /100 | #260 | Tragic 3.7% |
| Immigrants | Guyana | 1.0 /100 | #261 | Tragic 3.7% |
| U.S. Virgin Islanders | 1.0 /100 | #262 | Tragic 3.7% |
| Hopi | 0.9 /100 | #263 | Tragic 3.6% |
| Immigrants | Cambodia | 0.9 /100 | #264 | Tragic 3.6% |
| Immigrants | Congo | 0.8 /100 | #265 | Tragic 3.6% |
| Central American Indians | 0.8 /100 | #266 | Tragic 3.6% |
| Delaware | 0.7 /100 | #267 | Tragic 3.6% |
| Aleuts | 0.7 /100 | #268 | Tragic 3.6% |
| Immigrants | Cuba | 0.6 /100 | #269 | Tragic 3.6% |
| Central Americans | 0.6 /100 | #270 | Tragic 3.6% |
| Belizeans | 0.5 /100 | #271 | Tragic 3.6% |
| Immigrants | Jamaica | 0.5 /100 | #272 | Tragic 3.6% |