Haitian vs West Indian GED/Equivalency
COMPARE
Haitian
West Indian
GED/Equivalency
GED/Equivalency Comparison
Haitians
West Indians
82.1%
GED/EQUIVALENCY
0.0/ 100
METRIC RATING
290th/ 347
METRIC RANK
83.1%
GED/EQUIVALENCY
0.2/ 100
METRIC RATING
265th/ 347
METRIC RANK
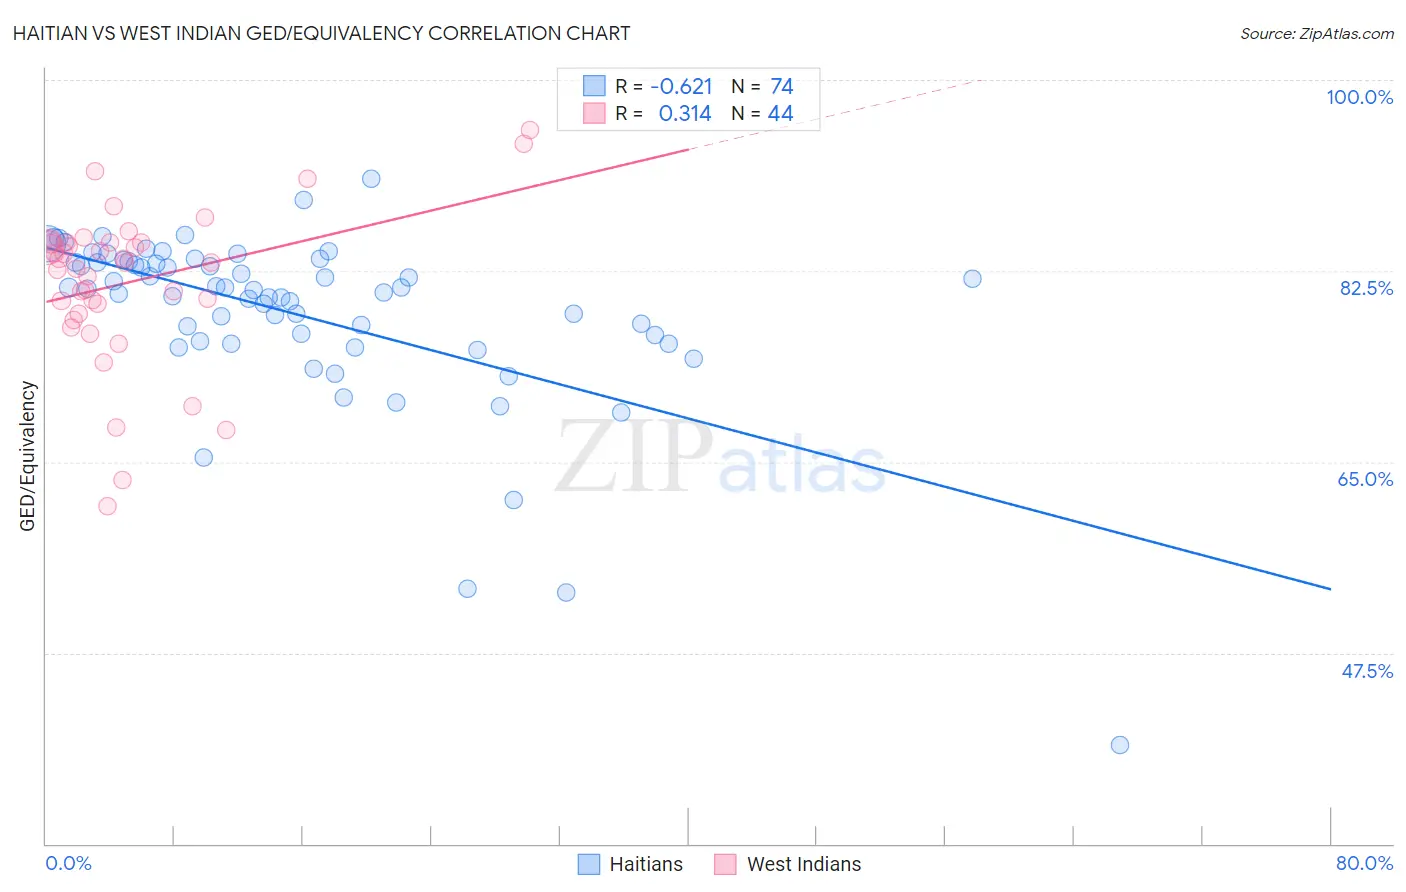
Haitian vs West Indian GED/Equivalency Correlation Chart
The statistical analysis conducted on geographies consisting of 288,018,742 people shows a significant negative correlation between the proportion of Haitians and percentage of population with at least ged/equivalency education in the United States with a correlation coefficient (R) of -0.621 and weighted average of 82.1%. Similarly, the statistical analysis conducted on geographies consisting of 254,063,654 people shows a mild positive correlation between the proportion of West Indians and percentage of population with at least ged/equivalency education in the United States with a correlation coefficient (R) of 0.314 and weighted average of 83.1%, a difference of 1.2%.
GED/Equivalency Correlation Summary
| Measurement | Haitian | West Indian |
| Minimum | 39.0% | 61.0% |
| Maximum | 90.9% | 95.4% |
| Range | 51.9% | 34.5% |
| Mean | 78.6% | 81.5% |
| Median | 80.8% | 83.3% |
| Interquartile 25% (IQ1) | 76.1% | 79.0% |
| Interquartile 75% (IQ3) | 83.3% | 85.1% |
| Interquartile Range (IQR) | 7.2% | 6.1% |
| Standard Deviation (Sample) | 8.2% | 7.2% |
| Standard Deviation (Population) | 8.1% | 7.1% |
Similar Demographics by GED/Equivalency
Demographics Similar to Haitians by GED/Equivalency
In terms of ged/equivalency, the demographic groups most similar to Haitians are Cuban (82.0%, a difference of 0.020%), Paiute (82.0%, a difference of 0.060%), British West Indian (82.0%, a difference of 0.070%), Immigrants from St. Vincent and the Grenadines (82.0%, a difference of 0.090%), and Nepalese (81.9%, a difference of 0.15%).
| Demographics | Rating | Rank | GED/Equivalency |
| Indonesians | 0.1 /100 | #283 | Tragic 82.5% |
| Immigrants | Barbados | 0.1 /100 | #284 | Tragic 82.4% |
| Cajuns | 0.0 /100 | #285 | Tragic 82.4% |
| Immigrants | West Indies | 0.0 /100 | #286 | Tragic 82.4% |
| Japanese | 0.0 /100 | #287 | Tragic 82.4% |
| Pueblo | 0.0 /100 | #288 | Tragic 82.3% |
| Immigrants | Cambodia | 0.0 /100 | #289 | Tragic 82.2% |
| Haitians | 0.0 /100 | #290 | Tragic 82.1% |
| Cubans | 0.0 /100 | #291 | Tragic 82.0% |
| Paiute | 0.0 /100 | #292 | Tragic 82.0% |
| British West Indians | 0.0 /100 | #293 | Tragic 82.0% |
| Immigrants | St. Vincent and the Grenadines | 0.0 /100 | #294 | Tragic 82.0% |
| Nepalese | 0.0 /100 | #295 | Tragic 81.9% |
| Vietnamese | 0.0 /100 | #296 | Tragic 81.9% |
| Immigrants | Bangladesh | 0.0 /100 | #297 | Tragic 81.9% |
Demographics Similar to West Indians by GED/Equivalency
In terms of ged/equivalency, the demographic groups most similar to West Indians are Bangladeshi (83.1%, a difference of 0.010%), Kiowa (83.1%, a difference of 0.010%), Immigrants from Congo (83.1%, a difference of 0.020%), Trinidadian and Tobagonian (83.0%, a difference of 0.020%), and Inupiat (83.1%, a difference of 0.030%).
| Demographics | Rating | Rank | GED/Equivalency |
| Malaysians | 0.4 /100 | #258 | Tragic 83.3% |
| Immigrants | Vietnam | 0.3 /100 | #259 | Tragic 83.2% |
| Choctaw | 0.3 /100 | #260 | Tragic 83.1% |
| Inupiat | 0.2 /100 | #261 | Tragic 83.1% |
| Immigrants | Armenia | 0.2 /100 | #262 | Tragic 83.1% |
| Immigrants | Congo | 0.2 /100 | #263 | Tragic 83.1% |
| Bangladeshis | 0.2 /100 | #264 | Tragic 83.1% |
| West Indians | 0.2 /100 | #265 | Tragic 83.1% |
| Kiowa | 0.2 /100 | #266 | Tragic 83.1% |
| Trinidadians and Tobagonians | 0.2 /100 | #267 | Tragic 83.0% |
| Immigrants | Burma/Myanmar | 0.2 /100 | #268 | Tragic 83.0% |
| Hopi | 0.2 /100 | #269 | Tragic 83.0% |
| Immigrants | Jamaica | 0.2 /100 | #270 | Tragic 82.9% |
| U.S. Virgin Islanders | 0.2 /100 | #271 | Tragic 82.9% |
| Barbadians | 0.1 /100 | #272 | Tragic 82.9% |