Alaskan Athabascan vs Uruguayan Single Father Households
COMPARE
Alaskan Athabascan
Uruguayan
Single Father Households
Single Father Households Comparison
Alaskan Athabascans
Uruguayans
3.4%
SINGLE FATHER HOUSEHOLDS
0.0/ 100
METRIC RATING
339th/ 347
METRIC RANK
2.4%
SINGLE FATHER HOUSEHOLDS
29.7/ 100
METRIC RATING
193rd/ 347
METRIC RANK
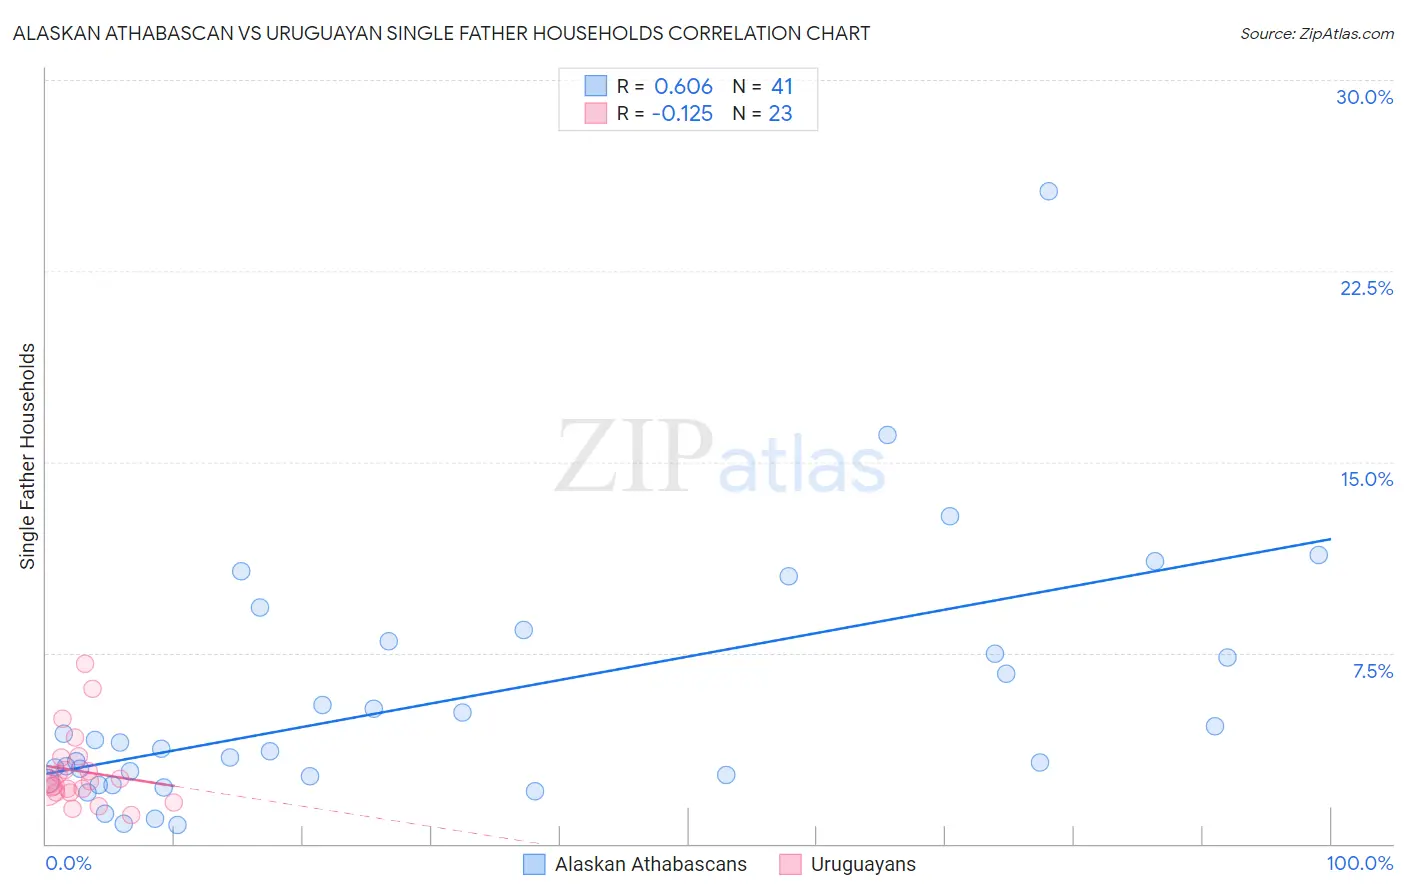
Alaskan Athabascan vs Uruguayan Single Father Households Correlation Chart
The statistical analysis conducted on geographies consisting of 45,717,471 people shows a significant positive correlation between the proportion of Alaskan Athabascans and percentage of single father households in the United States with a correlation coefficient (R) of 0.606 and weighted average of 3.4%. Similarly, the statistical analysis conducted on geographies consisting of 144,465,475 people shows a poor negative correlation between the proportion of Uruguayans and percentage of single father households in the United States with a correlation coefficient (R) of -0.125 and weighted average of 2.4%, a difference of 42.1%.
Single Father Households Correlation Summary
| Measurement | Alaskan Athabascan | Uruguayan |
| Minimum | 0.71% | 1.1% |
| Maximum | 25.6% | 7.1% |
| Range | 24.9% | 5.9% |
| Mean | 5.6% | 2.9% |
| Median | 3.7% | 2.4% |
| Interquartile 25% (IQ1) | 2.6% | 2.0% |
| Interquartile 75% (IQ3) | 7.7% | 3.4% |
| Interquartile Range (IQR) | 5.2% | 1.3% |
| Standard Deviation (Sample) | 4.9% | 1.5% |
| Standard Deviation (Population) | 4.8% | 1.4% |
Similar Demographics by Single Father Households
Demographics Similar to Alaskan Athabascans by Single Father Households
In terms of single father households, the demographic groups most similar to Alaskan Athabascans are Sioux (3.3%, a difference of 1.5%), Pueblo (3.3%, a difference of 2.1%), Paiute (3.3%, a difference of 2.4%), Colville (3.3%, a difference of 2.4%), and Yuman (3.3%, a difference of 2.5%).
| Demographics | Rating | Rank | Single Father Households |
| Yaqui | 0.0 /100 | #332 | Tragic 3.2% |
| Natives/Alaskans | 0.0 /100 | #333 | Tragic 3.2% |
| Yuman | 0.0 /100 | #334 | Tragic 3.3% |
| Colville | 0.0 /100 | #335 | Tragic 3.3% |
| Paiute | 0.0 /100 | #336 | Tragic 3.3% |
| Pueblo | 0.0 /100 | #337 | Tragic 3.3% |
| Sioux | 0.0 /100 | #338 | Tragic 3.3% |
| Alaskan Athabascans | 0.0 /100 | #339 | Tragic 3.4% |
| Alaska Natives | 0.0 /100 | #340 | Tragic 3.5% |
| Crow | 0.0 /100 | #341 | Tragic 3.5% |
| Tohono O'odham | 0.0 /100 | #342 | Tragic 3.8% |
| Pima | 0.0 /100 | #343 | Tragic 4.2% |
| Yakama | 0.0 /100 | #344 | Tragic 4.2% |
| Menominee | 0.0 /100 | #345 | Tragic 4.2% |
| Inupiat | 0.0 /100 | #346 | Tragic 4.9% |
Demographics Similar to Uruguayans by Single Father Households
In terms of single father households, the demographic groups most similar to Uruguayans are Immigrants from Sudan (2.4%, a difference of 0.010%), Panamanian (2.4%, a difference of 0.010%), Immigrants from Africa (2.4%, a difference of 0.030%), Immigrants from Philippines (2.4%, a difference of 0.090%), and Kenyan (2.4%, a difference of 0.14%).
| Demographics | Rating | Rank | Single Father Households |
| Immigrants | Bosnia and Herzegovina | 40.4 /100 | #186 | Average 2.4% |
| Immigrants | Colombia | 34.0 /100 | #187 | Fair 2.4% |
| Hmong | 33.0 /100 | #188 | Fair 2.4% |
| U.S. Virgin Islanders | 31.8 /100 | #189 | Fair 2.4% |
| French | 31.7 /100 | #190 | Fair 2.4% |
| Immigrants | Africa | 30.0 /100 | #191 | Fair 2.4% |
| Immigrants | Sudan | 29.8 /100 | #192 | Fair 2.4% |
| Uruguayans | 29.7 /100 | #193 | Fair 2.4% |
| Panamanians | 29.6 /100 | #194 | Fair 2.4% |
| Immigrants | Philippines | 28.7 /100 | #195 | Fair 2.4% |
| Kenyans | 28.0 /100 | #196 | Fair 2.4% |
| Germans | 28.0 /100 | #197 | Fair 2.4% |
| Scandinavians | 27.4 /100 | #198 | Fair 2.4% |
| Immigrants | Vietnam | 27.1 /100 | #199 | Fair 2.4% |
| Peruvians | 27.1 /100 | #200 | Fair 2.4% |