Samoan vs Uruguayan College, Under 1 year
COMPARE
Samoan
Uruguayan
College, Under 1 year
College, Under 1 year Comparison
Samoans
Uruguayans
63.0%
COLLEGE, UNDER 1 YEAR
3.3/ 100
METRIC RATING
228th/ 347
METRIC RANK
64.2%
COLLEGE, UNDER 1 YEAR
15.6/ 100
METRIC RATING
203rd/ 347
METRIC RANK
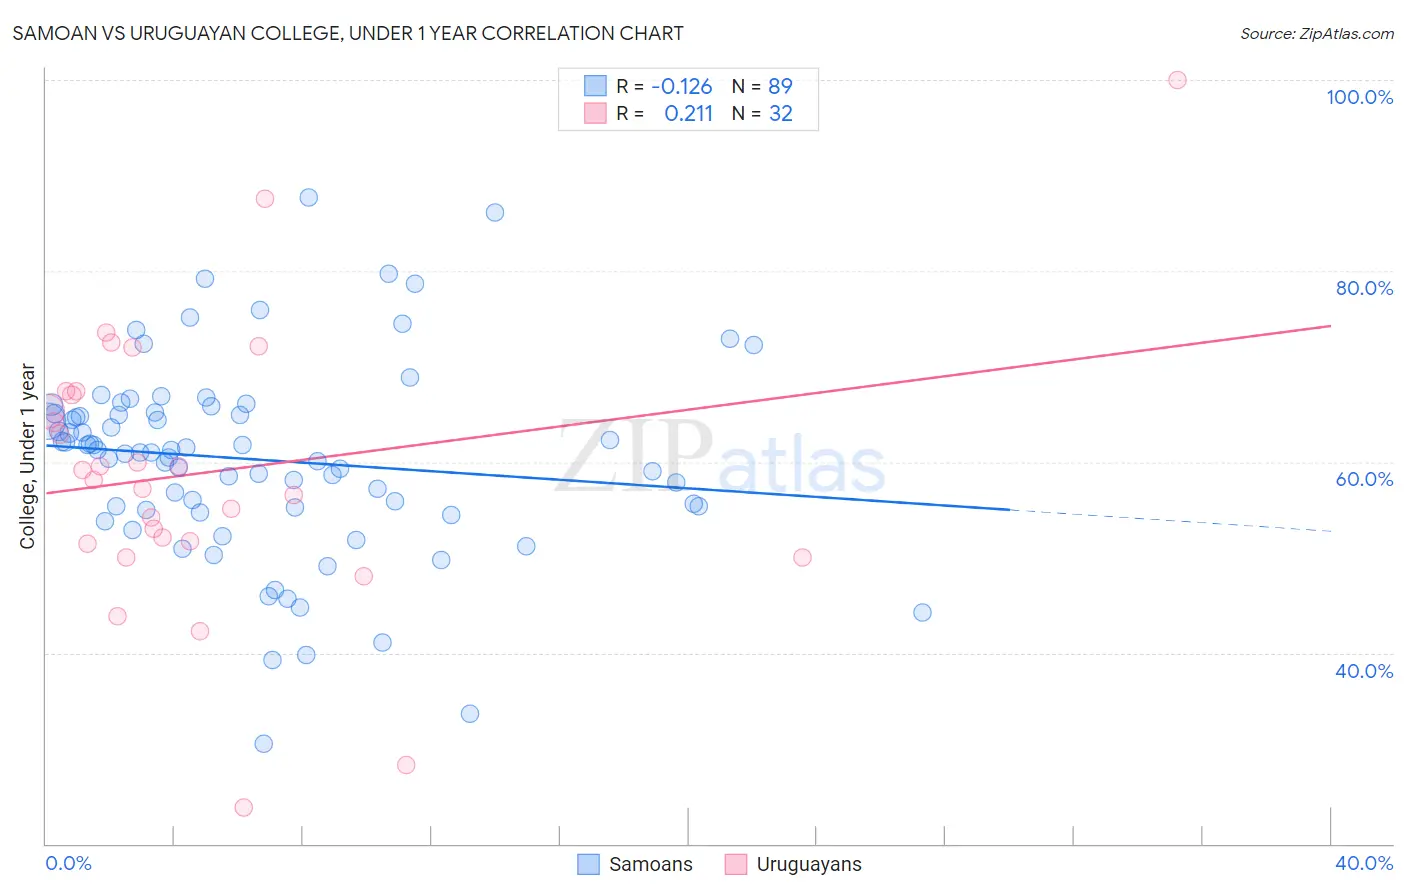
Samoan vs Uruguayan College, Under 1 year Correlation Chart
The statistical analysis conducted on geographies consisting of 225,205,919 people shows a poor negative correlation between the proportion of Samoans and percentage of population with at least college, under 1 year education in the United States with a correlation coefficient (R) of -0.126 and weighted average of 63.0%. Similarly, the statistical analysis conducted on geographies consisting of 144,782,794 people shows a weak positive correlation between the proportion of Uruguayans and percentage of population with at least college, under 1 year education in the United States with a correlation coefficient (R) of 0.211 and weighted average of 64.2%, a difference of 1.9%.
College, Under 1 year Correlation Summary
| Measurement | Samoan | Uruguayan |
| Minimum | 30.5% | 23.7% |
| Maximum | 87.7% | 100.0% |
| Range | 57.2% | 76.2% |
| Mean | 60.2% | 58.9% |
| Median | 61.0% | 58.7% |
| Interquartile 25% (IQ1) | 55.1% | 51.6% |
| Interquartile 75% (IQ3) | 65.1% | 67.2% |
| Interquartile Range (IQR) | 10.0% | 15.6% |
| Standard Deviation (Sample) | 10.3% | 14.8% |
| Standard Deviation (Population) | 10.3% | 14.5% |
Similar Demographics by College, Under 1 year
Demographics Similar to Samoans by College, Under 1 year
In terms of college, under 1 year, the demographic groups most similar to Samoans are Liberian (63.0%, a difference of 0.050%), Immigrants from Ghana (63.1%, a difference of 0.11%), Nonimmigrants (62.9%, a difference of 0.13%), Immigrants from Colombia (63.1%, a difference of 0.20%), and Immigrants from Peru (63.1%, a difference of 0.22%).
| Demographics | Rating | Rank | College, Under 1 year |
| Cree | 5.2 /100 | #221 | Tragic 63.3% |
| Immigrants | Senegal | 5.0 /100 | #222 | Tragic 63.3% |
| Immigrants | Costa Rica | 4.5 /100 | #223 | Tragic 63.2% |
| Sub-Saharan Africans | 4.4 /100 | #224 | Tragic 63.2% |
| Immigrants | Peru | 4.0 /100 | #225 | Tragic 63.1% |
| Immigrants | Colombia | 4.0 /100 | #226 | Tragic 63.1% |
| Immigrants | Ghana | 3.7 /100 | #227 | Tragic 63.1% |
| Samoans | 3.3 /100 | #228 | Tragic 63.0% |
| Liberians | 3.2 /100 | #229 | Tragic 63.0% |
| Immigrants | Nonimmigrants | 3.0 /100 | #230 | Tragic 62.9% |
| Immigrants | Western Africa | 2.4 /100 | #231 | Tragic 62.8% |
| Osage | 2.2 /100 | #232 | Tragic 62.7% |
| Iroquois | 2.0 /100 | #233 | Tragic 62.6% |
| Chippewa | 2.0 /100 | #234 | Tragic 62.6% |
| Spanish Americans | 1.9 /100 | #235 | Tragic 62.6% |
Demographics Similar to Uruguayans by College, Under 1 year
In terms of college, under 1 year, the demographic groups most similar to Uruguayans are French Canadian (64.2%, a difference of 0.050%), South American (64.2%, a difference of 0.050%), Nigerian (64.3%, a difference of 0.090%), Immigrants from Zaire (64.1%, a difference of 0.090%), and Panamanian (64.3%, a difference of 0.11%).
| Demographics | Rating | Rank | College, Under 1 year |
| Tongans | 21.2 /100 | #196 | Fair 64.5% |
| Costa Ricans | 19.6 /100 | #197 | Poor 64.4% |
| Tsimshian | 17.9 /100 | #198 | Poor 64.3% |
| Panamanians | 17.0 /100 | #199 | Poor 64.3% |
| Nigerians | 16.7 /100 | #200 | Poor 64.3% |
| French Canadians | 16.3 /100 | #201 | Poor 64.2% |
| South Americans | 16.2 /100 | #202 | Poor 64.2% |
| Uruguayans | 15.6 /100 | #203 | Poor 64.2% |
| Immigrants | Zaire | 14.6 /100 | #204 | Poor 64.1% |
| Peruvians | 13.7 /100 | #205 | Poor 64.1% |
| Whites/Caucasians | 12.8 /100 | #206 | Poor 64.0% |
| Colombians | 12.4 /100 | #207 | Poor 64.0% |
| Immigrants | Vietnam | 12.1 /100 | #208 | Poor 64.0% |
| Puget Sound Salish | 11.3 /100 | #209 | Poor 63.9% |
| Ghanaians | 11.2 /100 | #210 | Poor 63.9% |