Alaskan Athabascan vs Somali Unemployment Among Women with Children Under 18 years
COMPARE
Alaskan Athabascan
Somali
Unemployment Among Women with Children Under 18 years
Unemployment Among Women with Children Under 18 years Comparison
Alaskan Athabascans
Somalis
6.3%
UNEMPLOYMENT AMONG WOMEN WITH CHILDREN UNDER 18 YEARS
0.0/ 100
METRIC RATING
286th/ 347
METRIC RANK
5.8%
UNEMPLOYMENT AMONG WOMEN WITH CHILDREN UNDER 18 YEARS
3.5/ 100
METRIC RATING
228th/ 347
METRIC RANK
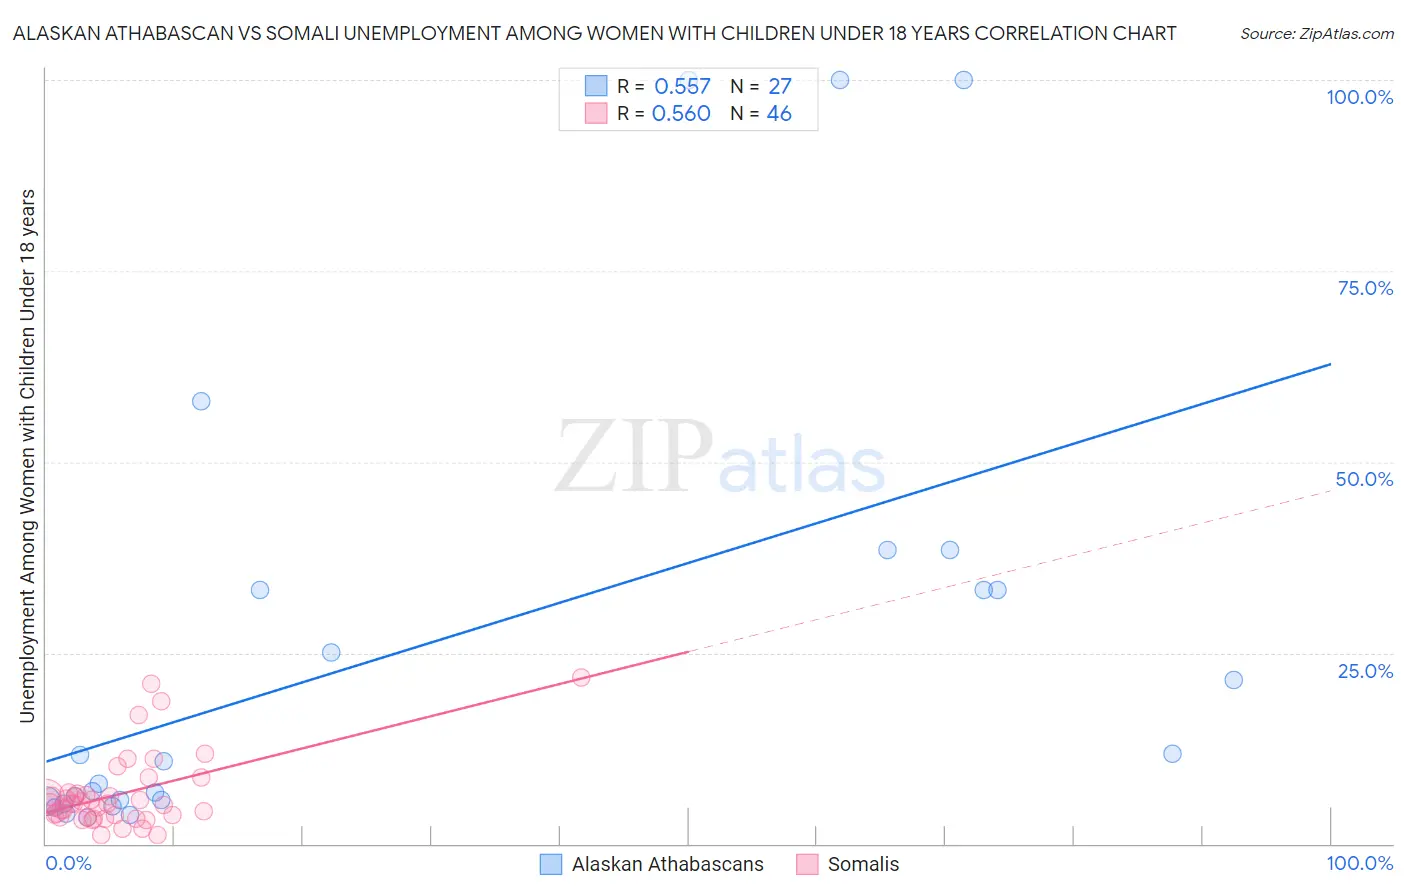
Alaskan Athabascan vs Somali Unemployment Among Women with Children Under 18 years Correlation Chart
The statistical analysis conducted on geographies consisting of 45,206,259 people shows a substantial positive correlation between the proportion of Alaskan Athabascans and unemployment rate among women with children under the age of 18 in the United States with a correlation coefficient (R) of 0.557 and weighted average of 6.3%. Similarly, the statistical analysis conducted on geographies consisting of 97,989,792 people shows a substantial positive correlation between the proportion of Somalis and unemployment rate among women with children under the age of 18 in the United States with a correlation coefficient (R) of 0.560 and weighted average of 5.8%, a difference of 9.8%.
Unemployment Among Women with Children Under 18 years Correlation Summary
| Measurement | Alaskan Athabascan | Somali |
| Minimum | 3.4% | 1.1% |
| Maximum | 100.0% | 21.7% |
| Range | 96.6% | 20.6% |
| Mean | 25.4% | 6.5% |
| Median | 10.8% | 5.3% |
| Interquartile 25% (IQ1) | 5.6% | 3.5% |
| Interquartile 75% (IQ3) | 33.3% | 6.6% |
| Interquartile Range (IQR) | 27.7% | 3.1% |
| Standard Deviation (Sample) | 30.4% | 4.8% |
| Standard Deviation (Population) | 29.9% | 4.7% |
Similar Demographics by Unemployment Among Women with Children Under 18 years
Demographics Similar to Alaskan Athabascans by Unemployment Among Women with Children Under 18 years
In terms of unemployment among women with children under 18 years, the demographic groups most similar to Alaskan Athabascans are Kiowa (6.3%, a difference of 0.010%), Cree (6.3%, a difference of 0.13%), Bahamian (6.3%, a difference of 0.15%), Immigrants from Grenada (6.3%, a difference of 0.30%), and West Indian (6.3%, a difference of 0.33%).
| Demographics | Rating | Rank | Unemployment Among Women with Children Under 18 years |
| Immigrants | Portugal | 0.0 /100 | #279 | Tragic 6.3% |
| Guatemalans | 0.0 /100 | #280 | Tragic 6.3% |
| Immigrants | El Salvador | 0.0 /100 | #281 | Tragic 6.3% |
| Immigrants | St. Vincent and the Grenadines | 0.0 /100 | #282 | Tragic 6.3% |
| West Indians | 0.0 /100 | #283 | Tragic 6.3% |
| Immigrants | Grenada | 0.0 /100 | #284 | Tragic 6.3% |
| Bahamians | 0.0 /100 | #285 | Tragic 6.3% |
| Alaskan Athabascans | 0.0 /100 | #286 | Tragic 6.3% |
| Kiowa | 0.0 /100 | #287 | Tragic 6.3% |
| Cree | 0.0 /100 | #288 | Tragic 6.3% |
| Immigrants | Caribbean | 0.0 /100 | #289 | Tragic 6.4% |
| Blackfeet | 0.0 /100 | #290 | Tragic 6.4% |
| Immigrants | Guatemala | 0.0 /100 | #291 | Tragic 6.4% |
| Mexicans | 0.0 /100 | #292 | Tragic 6.4% |
| Immigrants | Bangladesh | 0.0 /100 | #293 | Tragic 6.4% |
Demographics Similar to Somalis by Unemployment Among Women with Children Under 18 years
In terms of unemployment among women with children under 18 years, the demographic groups most similar to Somalis are Immigrants from Panama (5.8%, a difference of 0.090%), Sierra Leonean (5.8%, a difference of 0.14%), Immigrants from South America (5.8%, a difference of 0.15%), Immigrants from Africa (5.8%, a difference of 0.21%), and Creek (5.8%, a difference of 0.24%).
| Demographics | Rating | Rank | Unemployment Among Women with Children Under 18 years |
| Pennsylvania Germans | 5.7 /100 | #221 | Tragic 5.7% |
| Osage | 5.0 /100 | #222 | Tragic 5.7% |
| Potawatomi | 5.0 /100 | #223 | Tragic 5.7% |
| Immigrants | Syria | 4.6 /100 | #224 | Tragic 5.7% |
| Armenians | 4.5 /100 | #225 | Tragic 5.7% |
| Cherokee | 4.3 /100 | #226 | Tragic 5.7% |
| Sierra Leoneans | 3.8 /100 | #227 | Tragic 5.8% |
| Somalis | 3.5 /100 | #228 | Tragic 5.8% |
| Immigrants | Panama | 3.4 /100 | #229 | Tragic 5.8% |
| Immigrants | South America | 3.2 /100 | #230 | Tragic 5.8% |
| Immigrants | Africa | 3.1 /100 | #231 | Tragic 5.8% |
| Creek | 3.1 /100 | #232 | Tragic 5.8% |
| Spanish Americans | 3.1 /100 | #233 | Tragic 5.8% |
| Guamanians/Chamorros | 2.9 /100 | #234 | Tragic 5.8% |
| Immigrants | Middle Africa | 2.8 /100 | #235 | Tragic 5.8% |